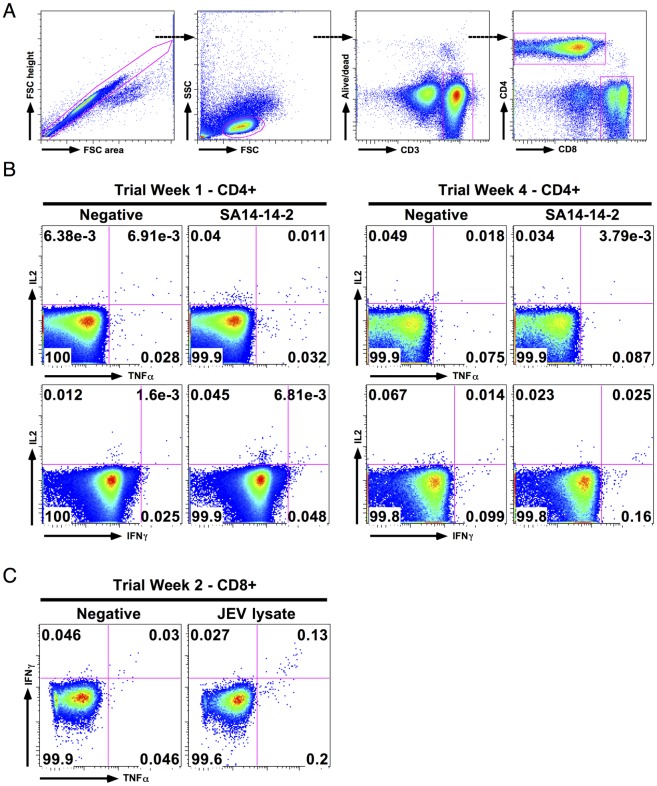
Fig 2. Example data of JE vaccine specific T cell responses by intracellular cytokine staining (ICS).
Example flow cytometry data from subject VA019/3, who was JEV NAb positive at baseline, throughout the first four weeks of the study are shown. Data are log10 fluorescence units. (A) Example gating strategy; the same strategy was used for all experiments. (B) CD4+ T cell responses at trial week 1 and week 4, measured by overnight stimulation of PBMC with approximately 104.4 PFU JEV SA14-14-2. A transient IL2 single positive response was present at week 1 that was no longer seen over the background at week 4. (C) CD8+ T cell response to wild type JEV infected cell lysate, used at 80 ng/ml JEV E protein concentration at trial week 2, measured by ICS after stimulation of whole blood for six hours. The CD8+ T cell IFNγ response was only detected at week 2, consistent with the peak in ELISpot response (S1 Fig).

