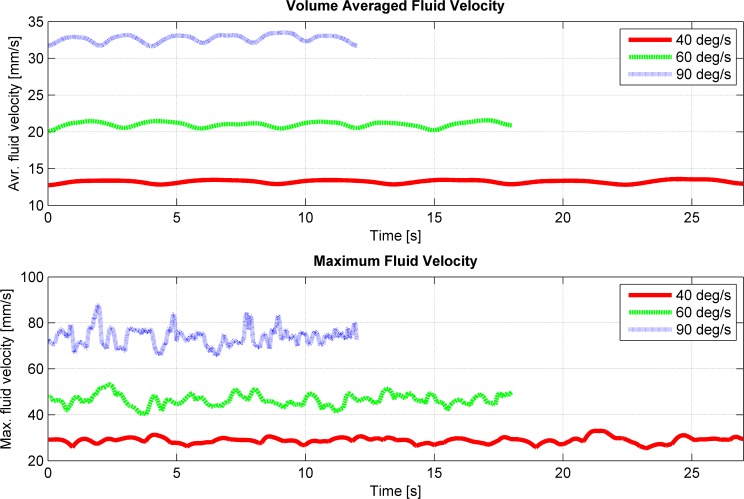
Fig 4. Velocity of the fluid in the flask during three periods on the RPM for three different rotational velocities (40, 60 and 90 deg/s).
Both frames rotate with constant and equal velocity, and the flask is placed at the center of rotation. Top: Volume average of the velocity plotted over time. Bottom: Fastest velocity plotted over time.

