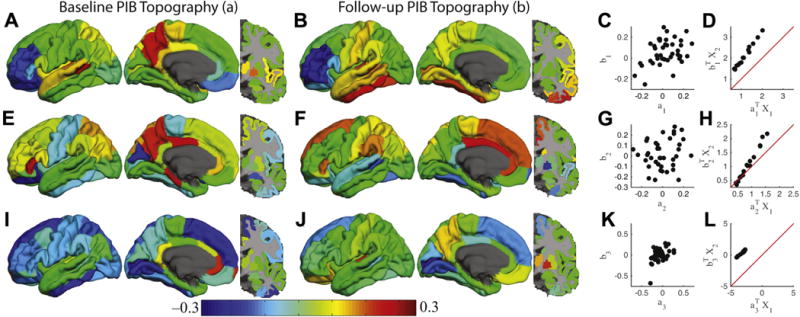
Fig. 2.

Canonical correlation analysis reveals distinct amyloid accumulation processes. The results corresponding to the first, second, and third canonical correlations are organized as individual rows. The first column (A, E, and I) shows the canonical variable (a) corresponding to the baseline PiB topography. The second column (B, F, and J) shows the canonical variable (b) corresponding to the follow-up PiB topography. These topographies are unit norm. The third column (C, G, and K) shows the correlation between the 2 canonical variables within a single canonical correlation. The fourth column (D, H, and L) shows the projection of the original data onto the canonical variables. Red line is the identity line. Abbreviation: PiB, Pittsburgh compound B. (For interpretation of the references to color in this figure legend, the reader is referred to the Web version of this article.)
