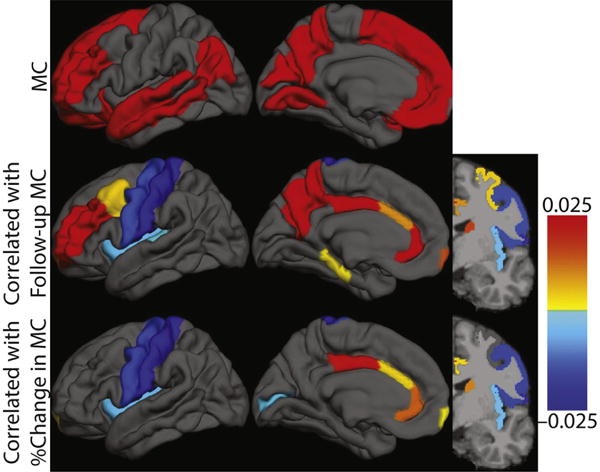
Fig. 5.

Topography of baseline Pittsburgh compound B deposition that correlates with follow-up and % change in mean cortical standardized uptake value ratio. Graphical representation of the information in Table 2. First row shows MC definition. Color bar indicates regression β values. Abbreviation: MC, mean cortical. (For interpretation of the references to color in this figure legend, the reader is referred to the Web version of this article.)
