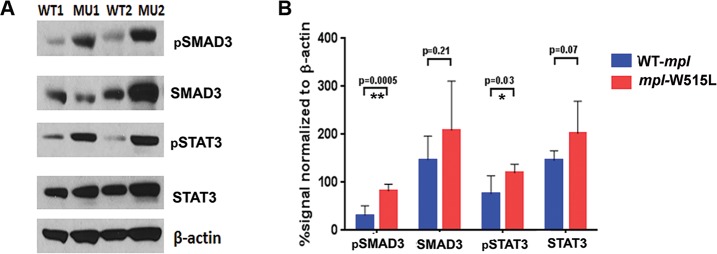
Fig 5. Elevated signaling pathways induced stably in MSCs from animals with MPN.
(A) Western blot analysis with (B) quantification of the bands for pSmad3, Smad3, pSTAT3, STAT3, and β-actin. Shown are cell extracts from WT1 and WT2 cell lines (MSCs derived from bone marrow expressing MPLWT) and MU1 and MU2 (MSCs derived from bone marrow expressing MPLW515L). The experimental results are representative of three. Statistical analysis was performed using 2-sided t test with significance <0.05.

