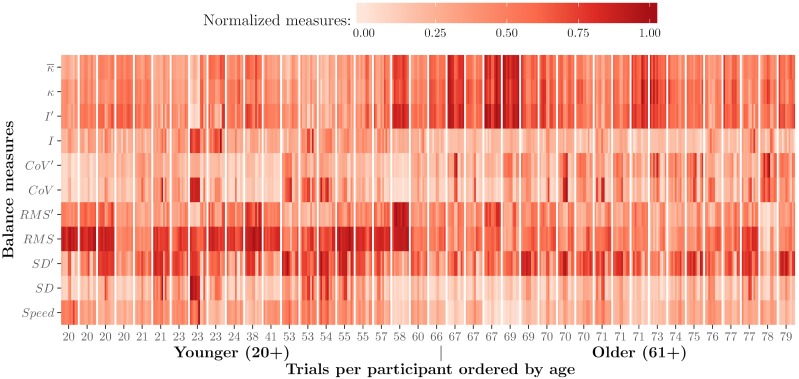
Fig 5. Heat map visualization of measures by trial and participant.
The horizontal axis represents trials, as vertical lines, per participant, with participants ordered by age; the vertical axis represents our measures of balance (—mean curvature, κ—median curvature, “′” represents a variant of the measure, I—turbulence intensity, CoV coefficient of variation, RMS—root mean square, SD—standard deviation), and shades of “red” indicate higher and lower values for measures of balance. This figure appeared in [54]. Eurographics Proceedings 2016. Reproduced by kind permission of the Eurographics Association.

