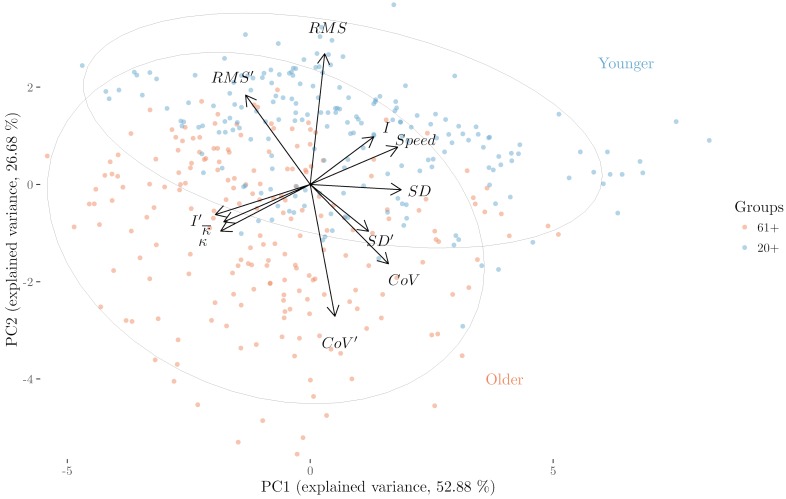
Fig 8. Biplot and projection of the balance measures onto the first two principal components PC1 and PC2.
The arrows represent the variable vectors and the ellipses cluster older and younger participants. This figure was adapted from [54]. Eurographics Proceedings 2016. Reproduced by kind permission of the Eurographics Association.

