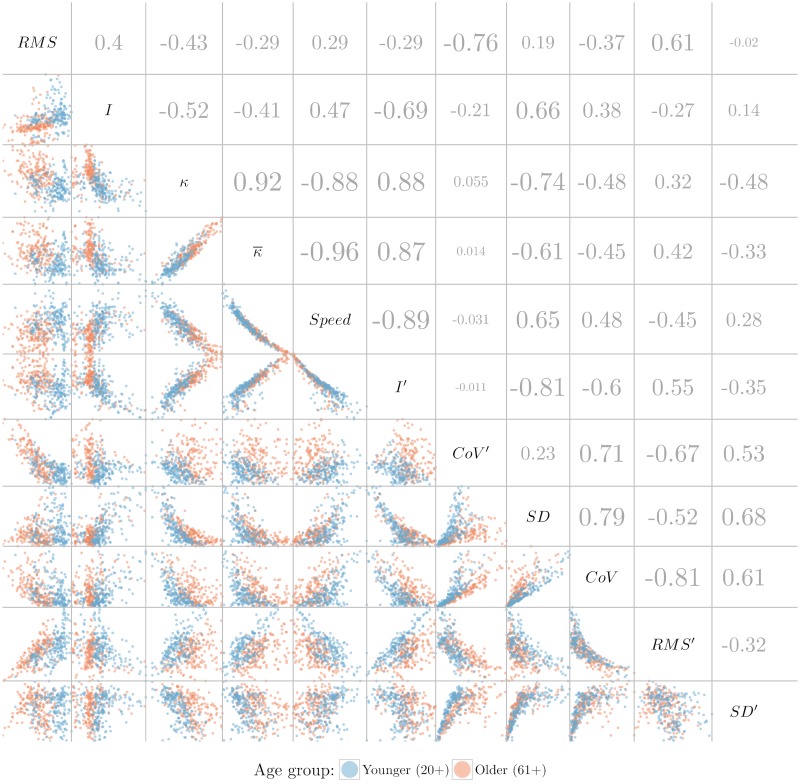
Fig 10. Correlation and scatterplot matrix.
Lower triangular matrix: scatterplot matrix, to maintain a good aspect ratio of the plots, values larger than 3.4 from the normalized data (2.5%) were excluded (only for visualization purposes). To estimate the correlation coefficients all data were used. Each point represents a single trajectory. Upper triangular matrix: Pearson correlation matrix. Larger font size indicates stronger correlation, either positive or negative. Absolute correlation values smaller than 0.21 are not significant.

