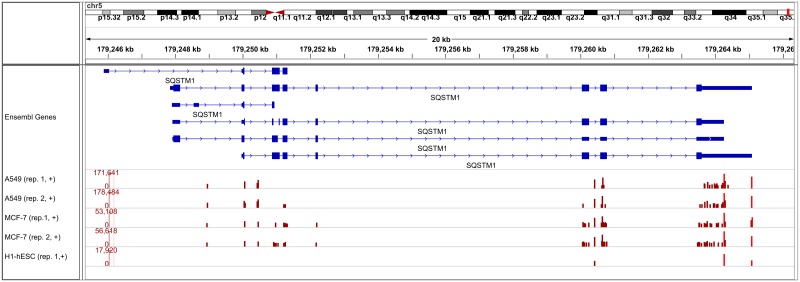
Fig 5. Transcript 3’ ends identified by RNA-PET for an example gene.
Poly(A) site clusters identified in the RNA-PET data with at least 20 reads are shown for the SQSTM1 gene. Only transcripts and clusters on the positive strand are shown. Transcripts annotated in Ensembl are indicated in the top row, with protein-coding exons and untranslated regions indicated by large and small boxes, respectively, introns by lines and strand by arrow heads. Poly(A) site clusters identified in all five RNA-PET samples are shown as boxes in rows 2-6, with the height of the boxes indicating the number of reads for each cluster (in log scale, the range of the y-axis is given in brackets on the left). Light red boxes indicate RNA-PET clusters corresponding to the annotated transcript ends.

