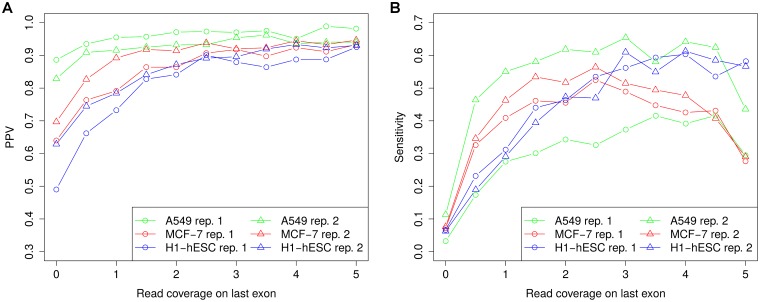
Fig 6. Correlation between read coverage on transcript ends and prediction performance.
Transcripts were binned according to the read coverage on the last exon (bin size 0.5) and PPV and sensitivity were calculated separately for each bin. The value on the x-axis indicates the minimum read coverage on the last exon for all transcripts in the corresponding bin and the last bin contains all transcripts with read coverage at least 5.

