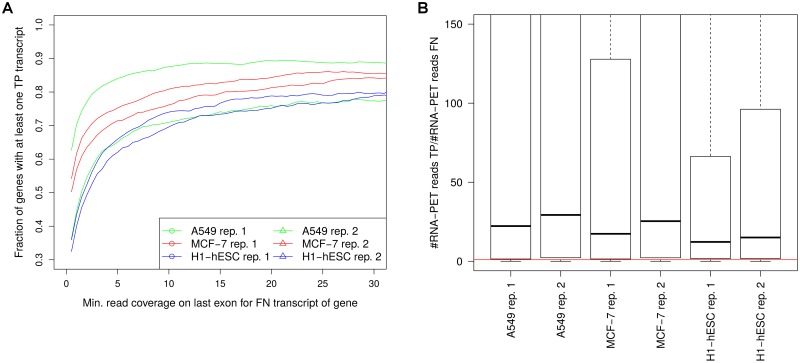
Fig 8. Lower RNA-PET read support for FN transcripts.
(A) Fraction of genes with at least one FN transcript 3’ end for which also a TP transcript 3’ end was detected plotted against the read coverage on the last exon of the FN transcript. For this purpose, we identified genes for which at least one FN transcript was observed with read coverage on the last exon at least a value t. We then calculated the fraction of these genes with at least a TP transcript and plotted these against increasing values of t. (B) Boxplot of the fold-change between the number of reads in the RNA-PET data for the best supported FN and TP transcript for each gene. Here, all genes with at least one FN transcript with read coverage on the last exon ≥ 2 were included. The red horizontal line indicates a fold-change of 1, showing that > 77% of genes had a TP transcript with higher read numbers in the RNA-PET data than the best FN transcript for the same gene.

