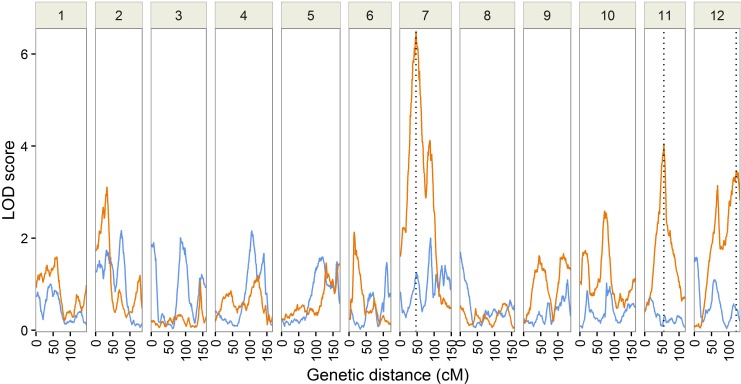
Fig 1. Results from QTL analysis of the F2 mapping population.
The LOD score patterns for total height (blue) and stem straightness (orange) over the 12 linkage groups of maritime pine are represented. The location of the QTLs (p < 0.05 at the genome wide level) is indicated by vertical dotted lines.

