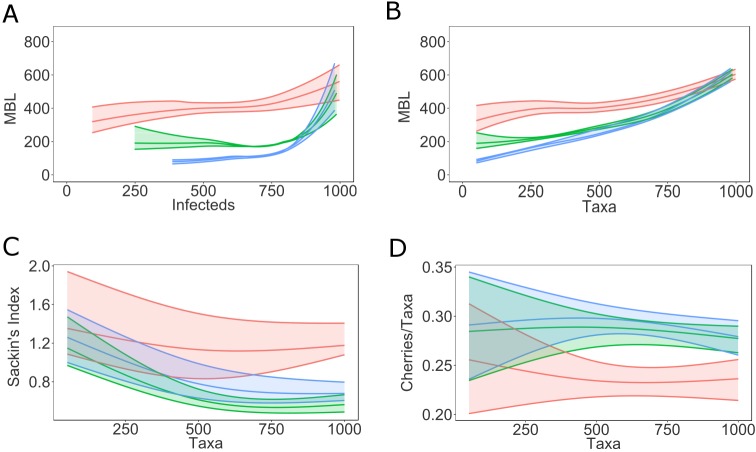
Fig 6. Distance based and topological tree statistics on virus genealogies as epidemic progresses on a network of size 1000.
Mean branch length (MBL) as function of the number of infected individuals (A) and as function of the number of taxa (sampled infected individuals) (B) for simulated outbreaks on networks of size 1000 as epidemics progress. Note that there is a time interval between infections and diagnoses (which correspond to removal/sampling times). Sackin’s index (C) and number of cherries per taxa (D) as function of the number of taxa in networks of size 1000. The envelopes represent 95% confidence intervals around the medians. The curves are obtained using local regression (LOESS). WS (red), ER (green), BA (blue).

