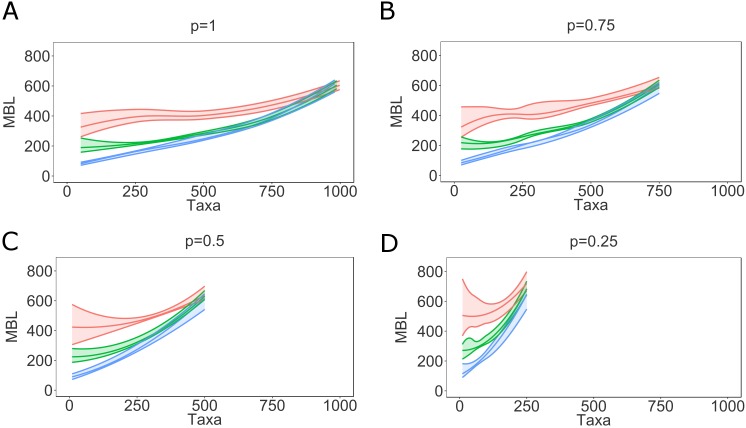
Fig 7. Mean branch length as function of the number of taxa varying sampling fraction.
Mean branch length as function of sampled hosts, with varying sampling fraction (p = 1-0.25). The envelopes represent 95% confidence intervals around the medians. The curves are obtained using local regression (LOESS). Note that for smaller sampling fractions the envelopes include fewer taxa. WS (red), ER (green), BA (blue).

