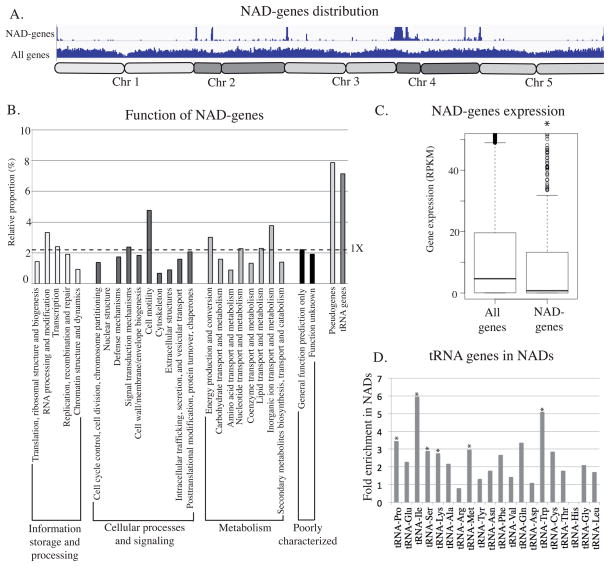
Figure 3. Description of NAD-gene.
A. Distribution of all genes and NAD-genes along all 5 chromosomes. B. Histogram displaying the relative enrichment of NAD-genes in each cluster of orthologous groups (COGs), among pseudogenes and tRNA-genes. The dotted line represents the 1X expected enrichment. C. Dot-plot revealing the relative expression of all genes or NAD-genes in 3 week-old leaves. D. Histogram displaying the relative enrichment of each class of tRNA genes in NADs. The asterisk is present when the enrichment is statistically demonstrated.

