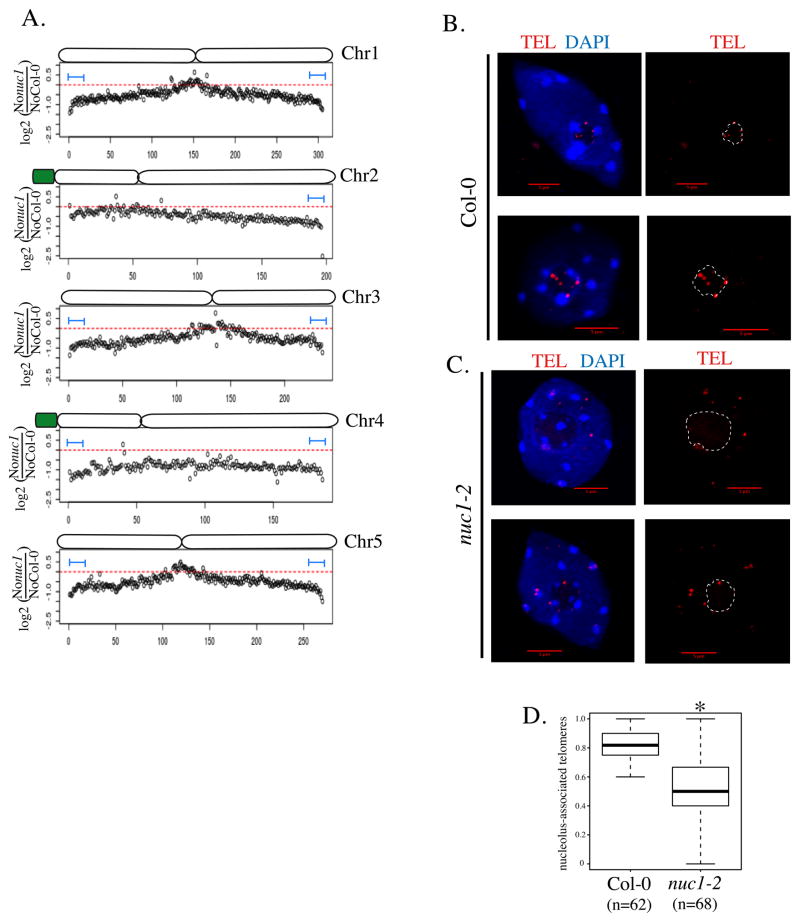
Figure 6. Telomere nucleolar clustering is affected in nuc1 mutant.
A. Chromosome-plot displaying the relative enrichment of genomic sequence as 100kb windows in the nucleolus on each 5 chromosomes of nuc1 mutant versus WT Col-0. B–C. DNA-FISH analyses using a telomere specific probe (red signal) on DAPI-stained nuclei (Blue) from WT Col-0 (B) or from nuc1 plants (C). D. Box-plot showing the proportion of nucleolus-associated telomeres in WT Col-0 (from 62 nuclei) and in nuc1 mutant (from 68 nuclei). The asterisk is present when the enrichment is statistically demonstrated.

