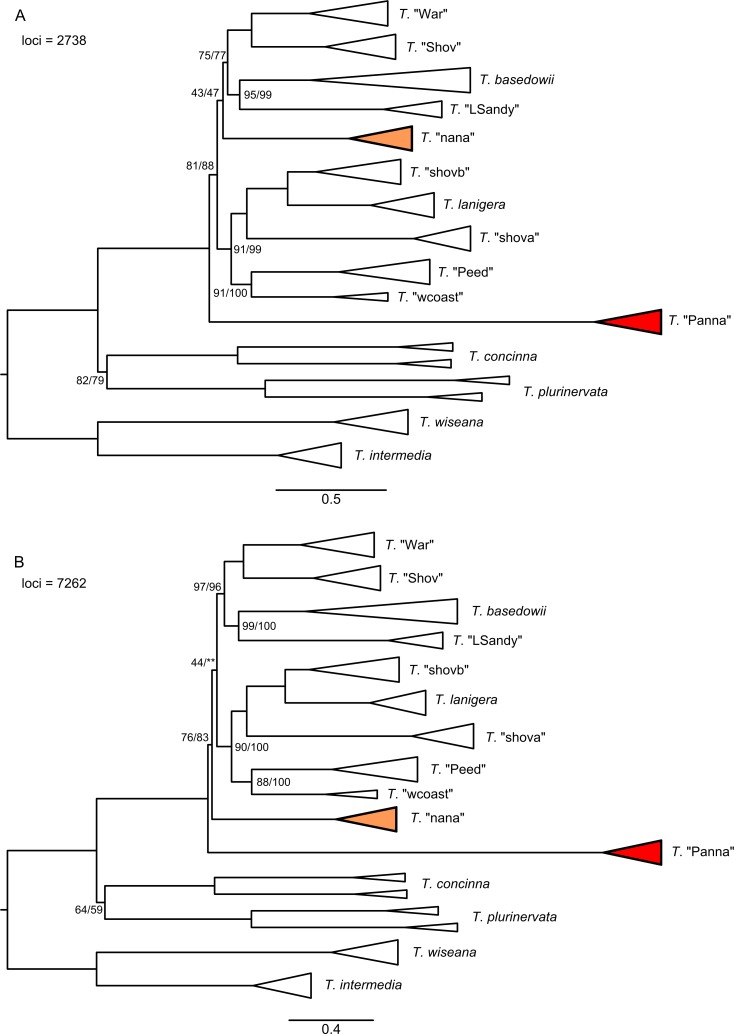
Fig 9. MP-EST trees (samples as species) for the combined data set and two assemblies.
A) 0.88/0.91 (merged/unmerged) clustering threshold, 50% minimum taxon coverage; B) 0.88/0.82 clustering threshold, 25% minimum taxon coverage. Scale bars are in coalescent units. Terminal branch lengths are not estimated, so the length of collapsed groups (triangles) is not reliable. All shown branch lengths are estimated by MP-EST. Support values from 100 multi-locus bootstrap replicates are only shown for branches with <100% support, for both analyses (samples as species / groups of samples as species). **In the analysis with groups of samples as species, T. "nana" grouped with the top four taxa (as in A) with 46% support.

