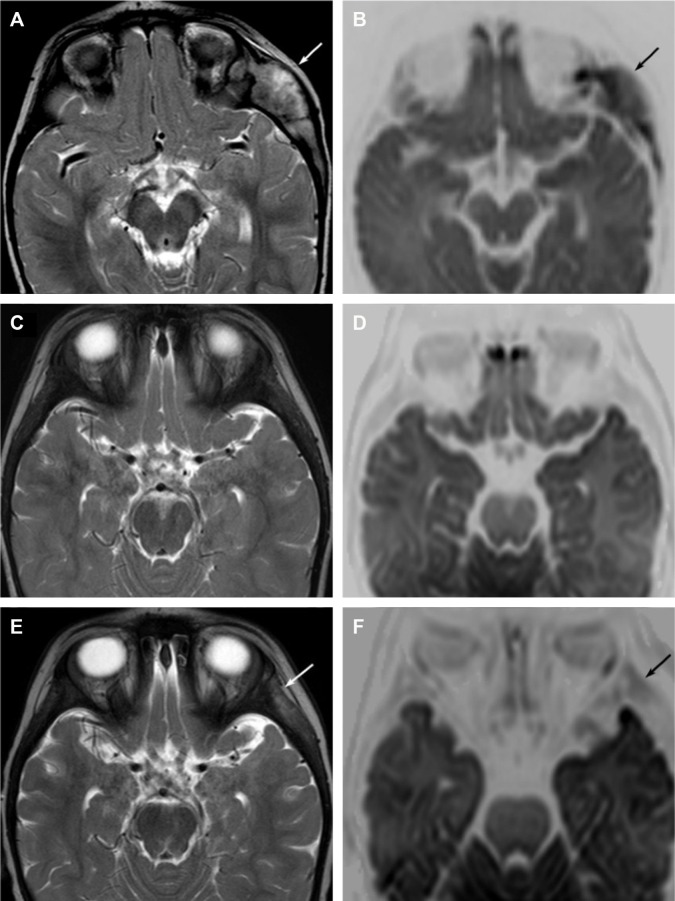
Figure 1.
The role of head MRI in the evaluation of therapy response.
Notes: (A) T2W image shows left temporal bone involvement of LCH (white arrow). (B) This lesion shows inhomogenous diffusion restriction (black arrow) on the diffusion-weighted image. (C and D) Normal appearance of the left temporal area after the initial chemotherapy on T2W and diffusion-weighted images. (E and F) Signal abnormality in the left temporal area on the T2W (white arrow) and diffusion-weighted (black arrow) images.
Abbreviations: LCH, Langerhans cell histiocytosis; MRI, magnetic resonance imaging.

