Figure 6.
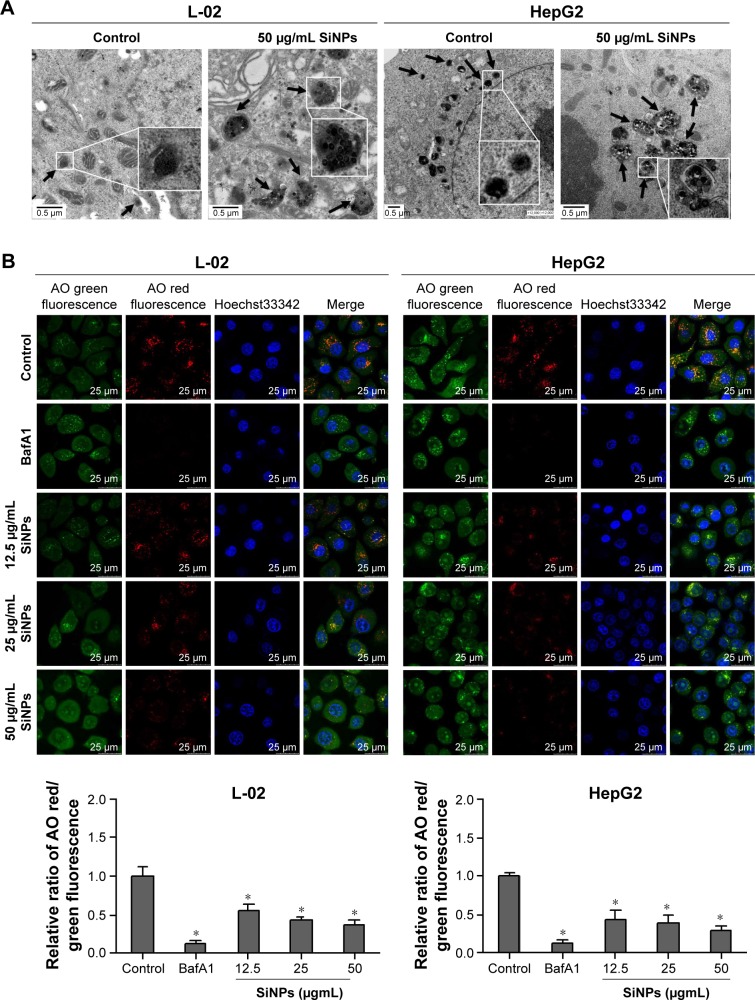
SiNPs blocked autophagic flux through impairing lysosomes.
Notes: (A) TEM images showed that SiNPs were accumulated in lysosomes (black arrows), causing swelling of lysosomes even when broken after SiNP exposure in both L-02 and HepG2 cells. Images of untreated control group showed the smaller intact lysosomes (black arrows). The selected areas were magnified. Scale bars, 0.5 μm. (B) AO staining was performed to evaluate the integrity of the lysosomal membrane in L-02 and HepG2 cells after exposure to SiNPs. Green fluorescence was acquired with excitation at 485 nm and emission at 530 nm; red fluorescence was acquired with excitation at 485 nm and emission at 620 nm using LSCM. Scale bars, 25 μm. The ratio of red and green fluorescence was calculated by Columbus software (*P<0.05).
Abbreviations: AO, acridine orange; BafA1, bafilomycin A1; LSCM, laser scanning confocal microscope; SiNPs, silica nanoparticles; TEM, transmission electron microscopy.

