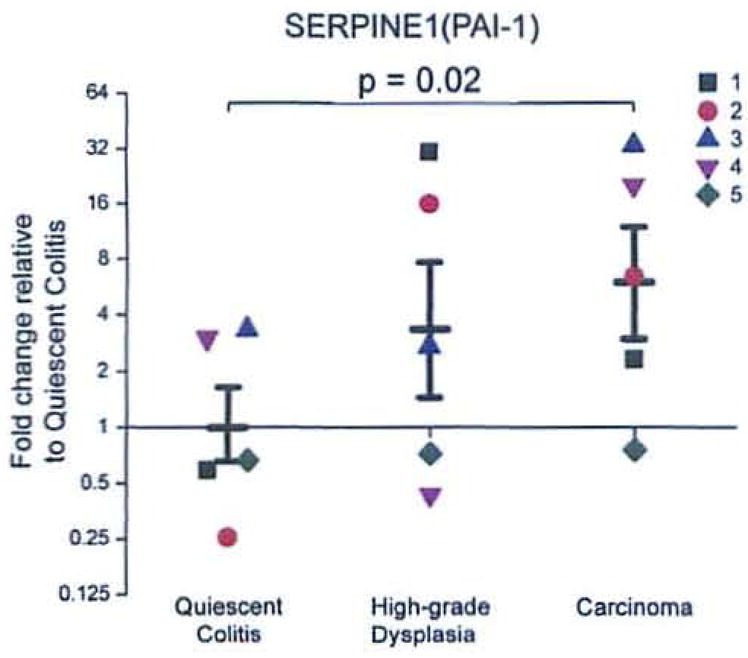
Figure 2.

mRNA expression of SERPINE1 is increased in the transition from quiescent colitis to carcinoma. Each group (n = 5) contains individual observations (each individual is a distinct color/shape) and means ± SEM for groups. Results were calculated using the ΔΔCt method and expressed as a fold change of the quiescent colitis group as described in the RT2 Profile™ PCR Array Data Analysis (http://www.sabiosciences.com/pcrarraydataanalysis.php).
