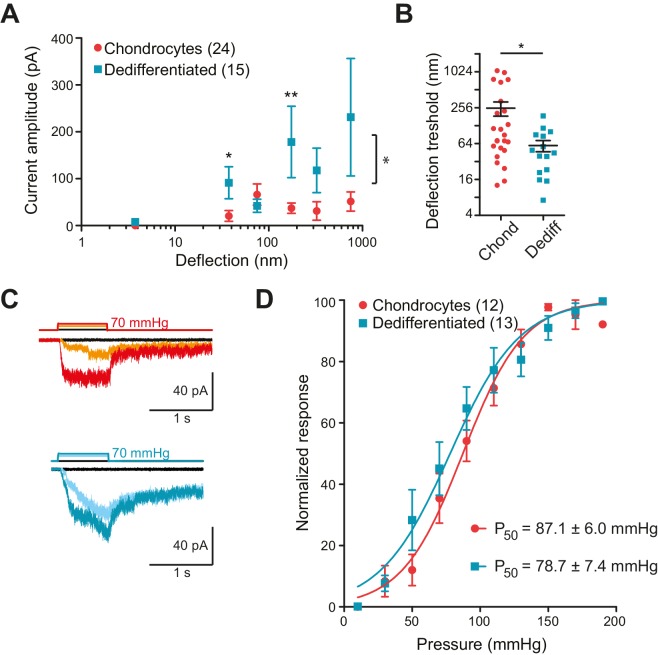
Figure 3. Chondrocytes and dedifferentiated cells display distinct mechanosenstivity to substrate deflections.
(A) Stimulus-response graph of deflection-gated currents in chondrocytes (red circles) and dedifferentiated cells (cyan squares). Measurements from an individual cell were binned according to stimulus size and current amplitudes were averaged within each bin, then across cells, data are displayed as mean ± s.e.m. For stimuli between 10–50 and 100–250 nm, the dedifferentiated cells exhibit significantly larger currents. (Mann-Whitney test *p=0.02 and **p=0.004, respectively, n = 24 chondrocytes and 15 dedifferentiated cells.) Additionally, an ordinary two-way ANOVA indicates that the cell-types differ in their overall response (*p=0.03). (B) Chondrocytes and dedifferentiated cells display distinct deflection thresholds to substrate deflections. A threshold was calculated by averaging the smallest deflection that resulted in channel gating, for each cell. The threshold for chondrocytes, 252 ± 68 (mean ± s.e.m., n = 24) was significantly higher than that calculated for dedifferentiated cells 59 ± 13 (mean ± s.e.m., n = 15) (Mann-Whitney, *p=0.028). (C) Representative traces from HSPC recordings of stretch-activated currents from outside-out patches pulled from chondrocytes (upper panel) and dedifferentiated cells (lower panel). (D) Stimulus-response curve of pressure-gated currents in chondrocytes (red) and dedifferentiated cells (cyan), normalized to maximal amplitude measured for each sample. (Data are displayed as mean ± s.e.m., n = 12 chondrocytes, 13 dedifferentiated cells.).
DOI: http://dx.doi.org/10.7554/eLife.21074.007

