. 2017 Jan 16;6:e22264. doi: 10.7554/eLife.22264

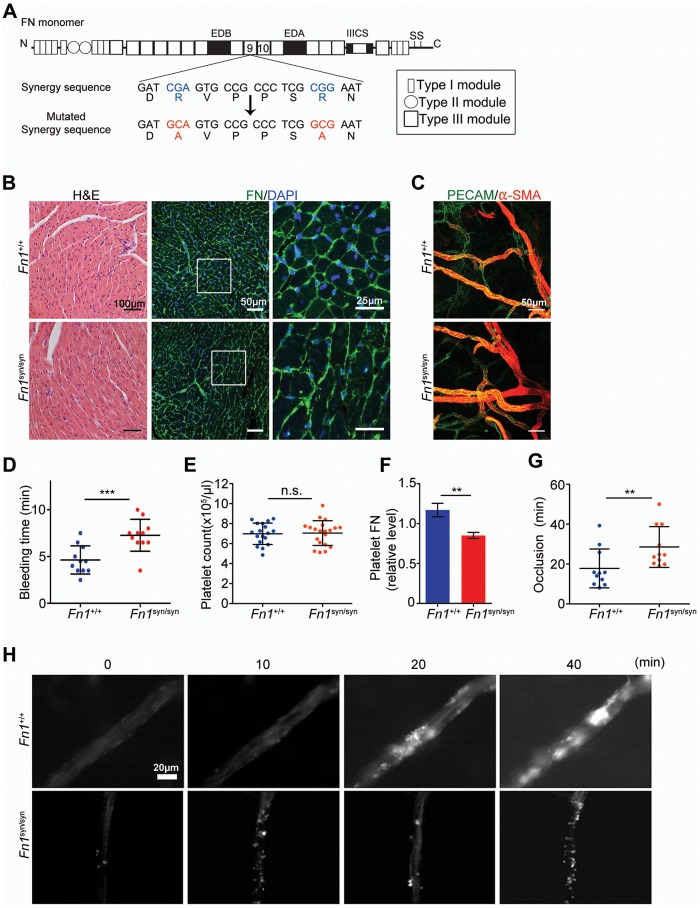
Figure 1. Normal tissue development and prolonged bleeding in Fn1syn/syn mice.

(A) Cartoon of FN and the nucleotide point mutations disrupting the function of the synergy site. (B) Representative images of 3-months-old Fn1 +/+ and Fn1syn/syn heart sections stained with H and E and immunostained for FN. (C) Confocal images of ear whole-mounts from 3 months-old mice immunostained with anti-PECAM-1 and anti-αSMA to visualize the dermal endothelial cell tubes and smooth muscle cells. (D) Bleeding time of 3-months-old Fn1+/+ (n = 11) and Fn1syn/syn (n = 11) mice. (E) Platelet counts in blood samples of Fn1+/+ (n = 18) and Fn1syn/syn (n = 19) mice. (F) FN content in platelets derived from Fn1+/+ (n = 6) and Fn1syn/syn (n = 6) mice relative to their vinculin levels. (G) Occlusion time of injured arterioles in the cremaster muscle of 3-months-old Fn1+/+ (n = 11) and Fn1syn/syn (n = 11) mice. (H) Representative still images of the arteriolar occlusion (white:platelets). Values are shown as mean ± SD; statistical significances were calculated using the Student t-test; **p<0.01 and ***p<0.001.

DOI: http://dx.doi.org/10.7554/eLife.22264.002

Figure 1.

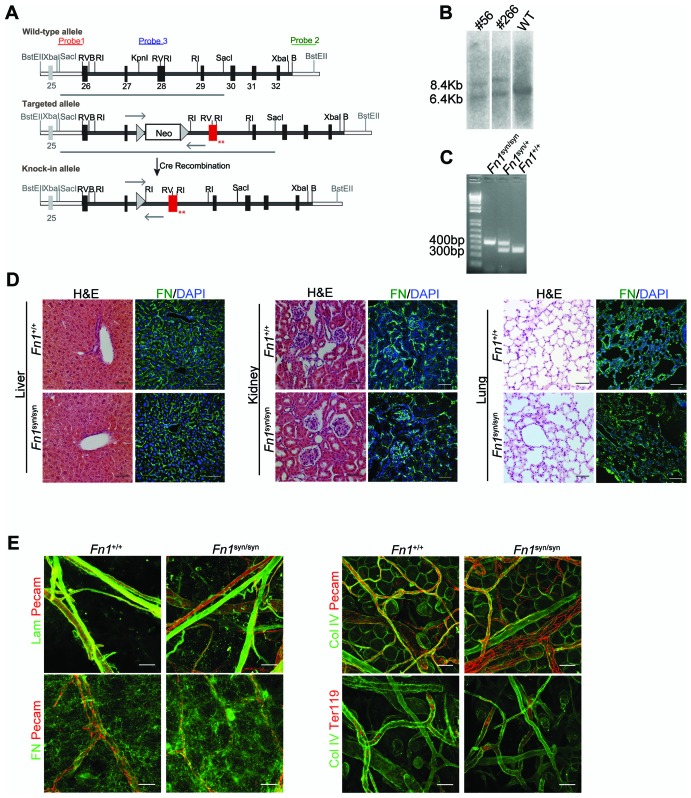
Figure 1—figure supplement 1. Strategy used to generate the Fn1syn/syn mice and tissue and platelet analysis.

Figure 1—figure supplement 1.

(A) Scheme of the FN gene and the targeting vector to generate the mouse with a dysfunctional synergy site. The synergy region is located in the FNIII9 and encoded in exon 28, shown in red. (B) The homologous recombination of the targeting vector was re-tested in ES cell clones 56 and 266 by Southern-blot using probe 1 SacI digested DNA. (C) Mice were genotyped by PCR using primers shown as arrows in (a). (D) Liver, kidney and lung sections from 3-months-old Fn1+/+ and Fn1syn/syn mice stained with H and E (scale bar, 100 μm) and immunostained for FN (scale bar, 50 μm). (E) Ear whole-mount staining of laminin (Lam), FN, collagen IV, and erythrocytes (Ter119) to analyze the sub-endothelial ECM composition and the integrity of blood vessels (scale bars, 50 μm and 25 μm for FN immunostaining).
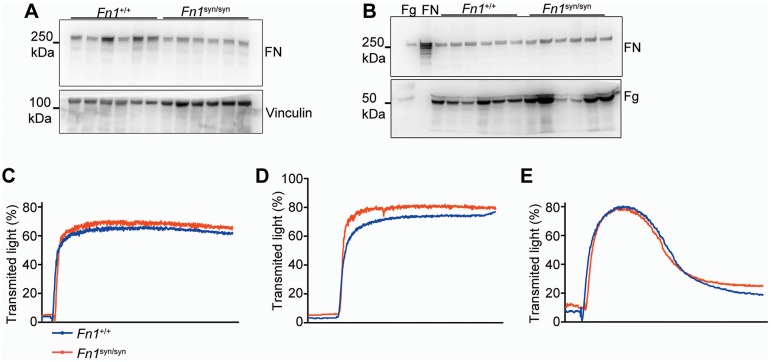
Figure 1—figure supplement 2. FN levels in platelets and blood from Fn1syn/synmice and platelet aggregation assays.

Figure 1—figure supplement 2.

(A) Western-blot to estimate FN levels in non-activated, washed platelets from Fn1+/+ (n = 6) and Fn1syn/syn mice (n = 6). (B) Western-blot to calculate FN and fibrinogen (Fg) levels in blood plasma from Fn1+/+ (n = 6) and Fn1syn/syn mice (n = 6). The first two lanes are commercial Fg and FN, respectively. (C–E) Representative in vitro aggregation assays using washed platelets from Fn1+/+ (n = 6) and FNsyn/syn mice (n = 8). Aggregation curves of platelets activated with 5 μg/ml collagen (C), with 0.5 u/ml thrombin (D) or with 20 μM ADP (E).