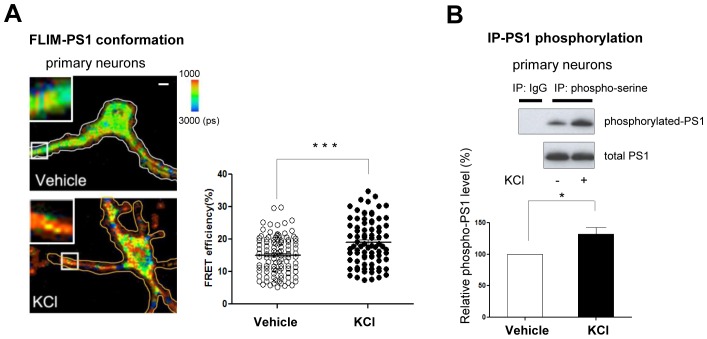
Figure 1. Ca2+ influx-triggered PS1 conformational change and increased phosphorylation.
(A) FLIM analysis of PS1 conformation. Pseudo-colored FLIM images of primary neurons treated with vehicle control or 50 mM KCl for 5 min. The neurons were stained with the antibodies to PS1 NT (Alexa488) and PS1 CT (Cy3). The colorimetric scale shows Alexa488 lifetime in picoseconds (ps). A scale bar indicates 10 µm. The graph shows quantitative analysis of the FRET efficiency between fluorescently labeled PS1 NT and PS1 CT in neuronal processes (total of 81–103 processes from 32–38 cells). Mean ± SEM, ***p<0.001, Student’s t-test. (B) Immunoprecipitation/Western blot analysis of PS1 phosphorylation. Primary neurons treated with vehicle control or 50 mM KCl for 5 min were immunoprecipitated with mouse and rabbit anti-phosphoserine antibody mixture, followed by immunoblotting with the anti-PS1 loop antibody (Upper panel, top row). Normal mouse and rabbit IgG mixture was used as negative control. Lower gel shows the total level of PS1 CTF in neuronal cell lysates. The graph presents a quantitative analysis of the band intensity for phosphorylated PS1 (n = 6). The relative PS1 phosphorylation level in KCl-treated neurons was normalized to that in vehicle-treated cells. Mean ± SEM, *p<0.05, One sample t-test.
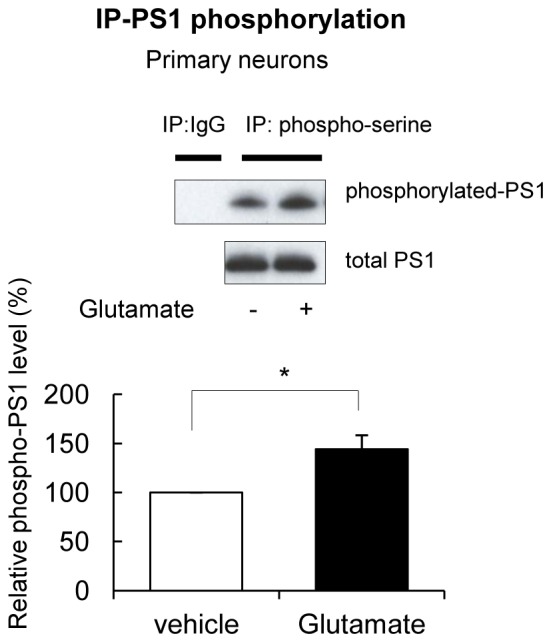
Figure 1—figure supplement 1. Glutamate treatment induces PS1 phosphorylation.


