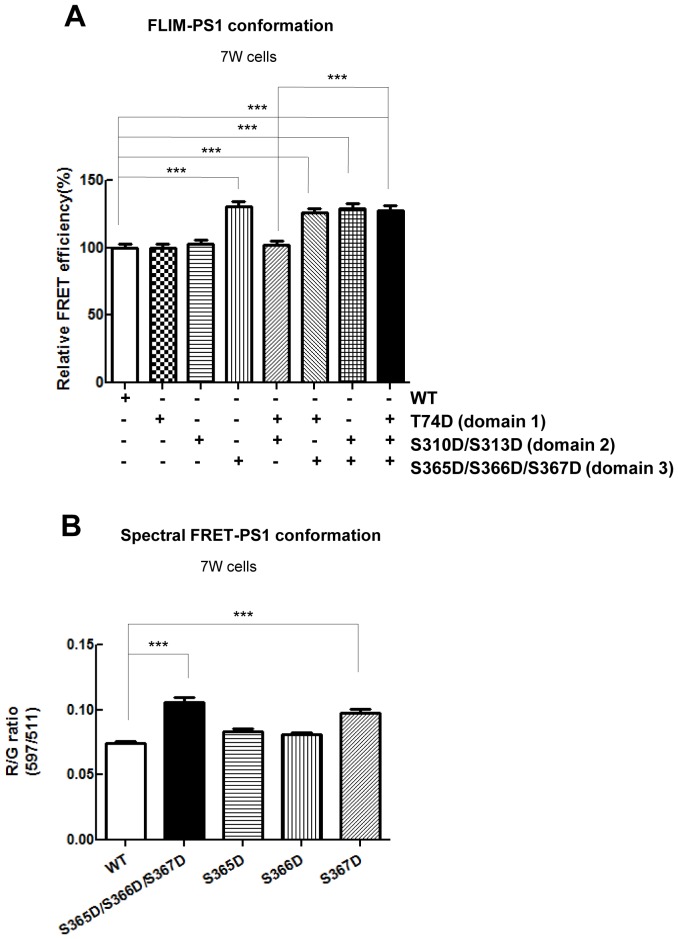
Figure 2. Phosphorylation mimicking mutations at S365-S366-S367 result in the PS1 conformational shift.
(A) FLIM analysis of the PS1 conformation in 7 W cells transfected with WT or phosphorylation-mimicking mutant G-PS1-R. The FRET efficiency between GFP and RFP in phospho-mutants is normalized to the average FRET efficiency of the WT G-PS1-R expressing cells (n = 42–53 cells). Mean ± SEM, ***p<0.001, one-way factorial ANOVA. (B) Spectral FRET analysis shows RFP/GFP (R/G) ratio in 7 W cells transfected with WT or single phosphorylation-mimicking mutant G-PS1-R (n = 50–69 cells). Mean ± SEM, ***p<0.001, one-way factorial ANOVA.


