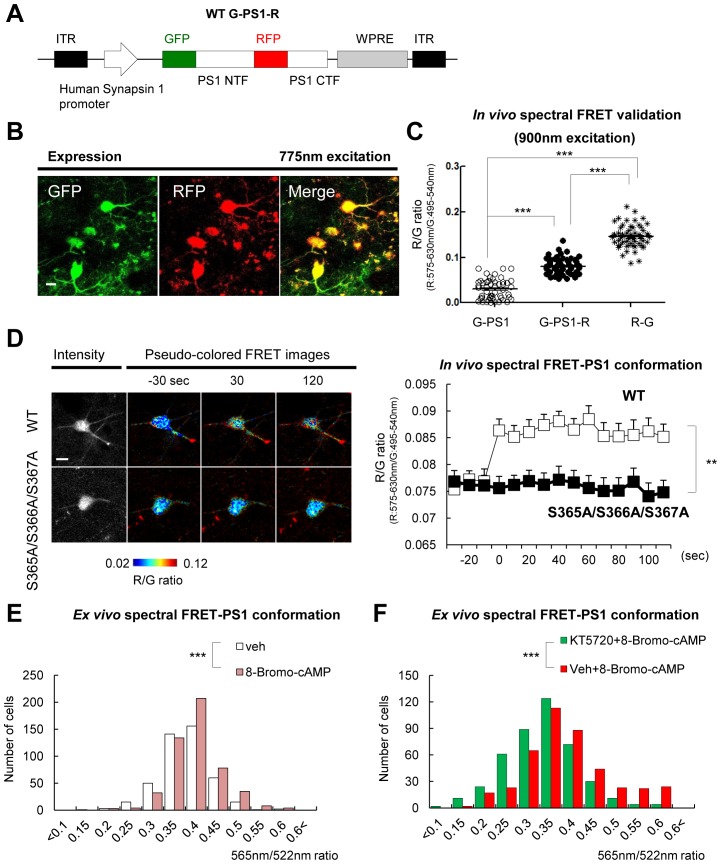
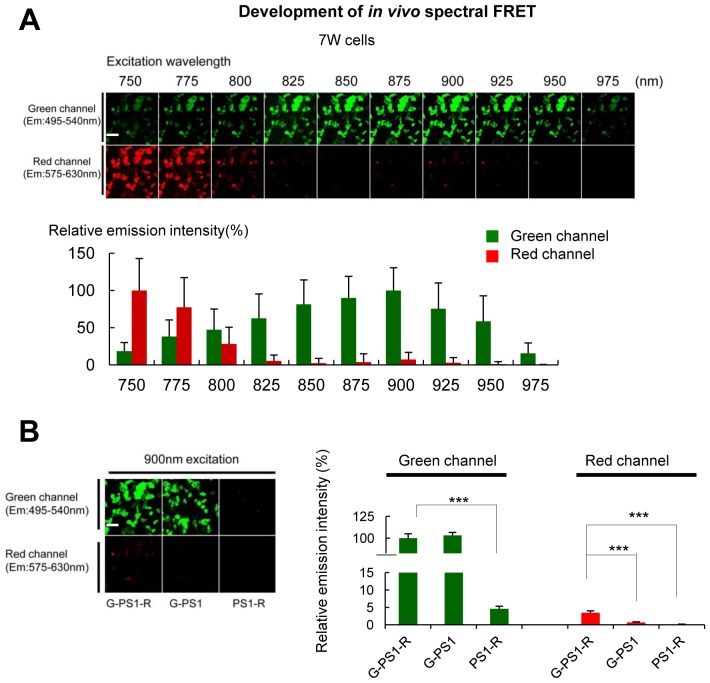
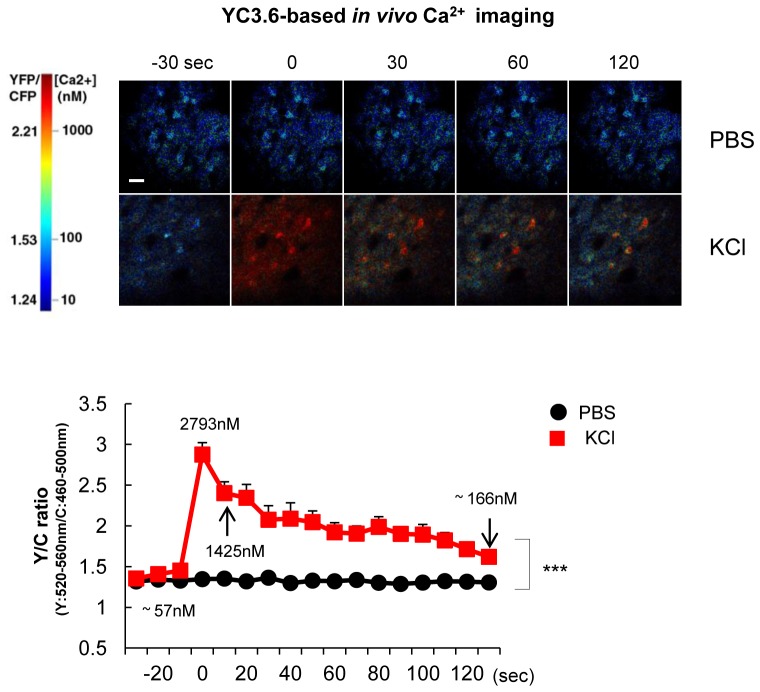
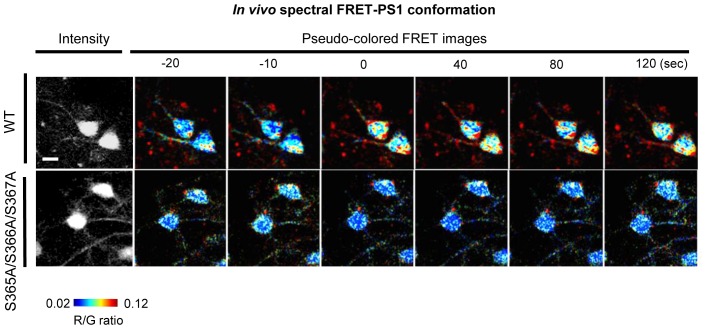
Figure 4. Ca2+ triggers the PS1/γ-secretase pathogenic conformation via PS1 phosphorylation in vivo.
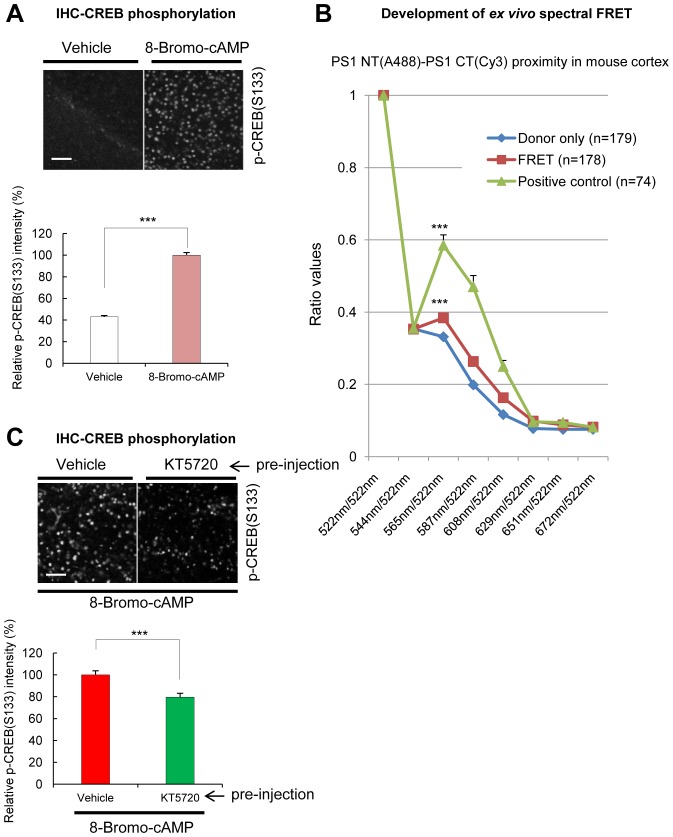
(A) Schematic representation of the pAAV8-hSyn1-WT G-PS1-R construct. (B) Two-photon image of the WT G-PS1-R expression in the somatosensory cortex of WT mouse. Laser at 775 nm wavelength was used for the excitation. A scale bar indicates 10 µm. (C) Mice were injected with AAV8-hSyn1-G-PS1 (as a negative control of FRET), AAV8-hSyn1-WT G-PS1-R or AAV8-hSyn1-R-G (as a positive control of FRET). GFP was excited at 900 nm wavelength, and the R/G ratio was recorded (n = 50–60 cells, n = 3–6 mice). Mean ± SEM, ***p<0.001, one-way factorial ANOVA. (D) Spectral FRET analysis of the PS1 conformation in vivo. Mice were injected with AAV8-hSyn1-WT G-PS1-R (n = 3) or AAV8-hSyn1-S365A/S366A/S367A G-PS1-R (n = 4), and 300 mM KCl was applied topically. The R/G ratio in vivo was monitored after two-photon excitation at 900 nm (total n = 20–28 cells per condition) for the duration of 2 min. Representative images of the pseudo-colored neurons are shown (additional time traces/images are shown in Figure 4—figure supplement 3). Mean ± SEM, **p<0.01, two-way repeated-measures ANOVA. (E) Ex-vivo spectral FRET analysis of the endogenous PS1 conformation in mouse brain sections. Mice were injected with 100 mM 8-Bromo-cAMP (right hemisphere) or vehicle (left hemisphere) into the somatosensory cortex. The 565 nm/522 nm ratio was calculated in individual neurons as readout of the FRET efficiency that reflects the relative proximity of the PS1 NT (A488) to PS1 CT (Cy3). The histogram shows cell numbers plotted against the 565 nm/522 nm ratios. n = 3 mice, total of 444 (vehicle) and 505 (8 Bromo-cAMP) neurons. ***p<0.001, Student’s t-test. (F) Ex-vivo spectral FRET analysis of the endogenous PS1 conformation in mouse brain sections. Mice were pre-injected with 100 µM KT5720 (right hemisphere) or vehicle (left hemisphere) into the somatosensory cortex. 75 min post-injection, 100 mM 8-Bromo-cAMP (both hemispheres) was delivered to the same area for 5 min. The histogram shows cell numbers plotted against the 565 nm/522 nm ratios. n = 3 mice, total 423 (vehicle) and 436 (KT5720) neurons analysed. ***p<0.001, Student’s t-test.

