. 2017 Jan 30;6:e19886. doi: 10.7554/eLife.19886

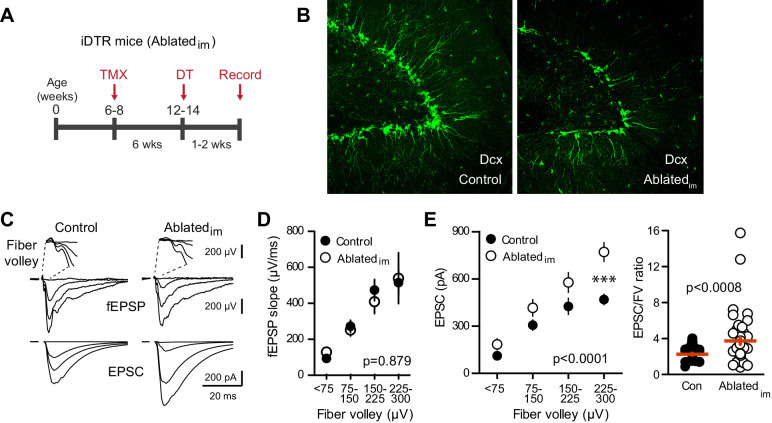
Figure 4. Ablating neurogenesis increases synaptic transmission to mature GCs.

(A) Experimental timeline showing ablation of immature GCs that are <6 weeks of age. Recordings from mature GCs were done 1–2 weeks after ablation. (B) Confocal images of Dcx-expressing immature neurons in control and Ablatedim mice. (C) Example of fEPSPs (top) with fiber volleys (FV, top insets) and simultaneously recorded EPSCs from mature GCs (bottom) in control and Ablatedim mice. (D) There was no difference in the fEPSP slope versus FV between Ablatedim and control mice (two-way ANOVA p=0.879, each symbol represents 8–22 responses from 7 control and 7 Ablatedim mice; FVs were binned by 75 μV). (E) The EPSC amplitude plotted against FV was larger in mature GCs from Ablatedim mice compared to controls (two-way ANOVA, Fgenotype (1,91)=30.31 p<0.0001; ***p<0.001 Bonferonni post-test). There was an increase in the overall EPSC/FV ratio in mature GCs from Ablatedim mice (unpaired t-test, p=0.0008, n = 42, 47).

DOI: http://dx.doi.org/10.7554/eLife.19886.009

Figure 4.

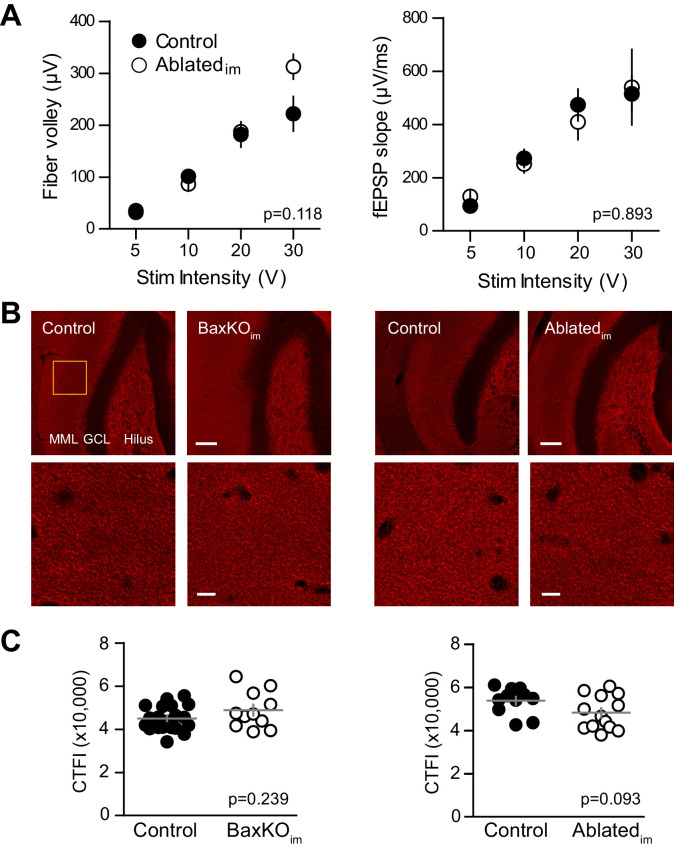
Figure 4—figure supplement 1. No change in FV, fEPSP slope or vGlut1 expression.

Figure 4—figure supplement 1.

(A) There was no difference in the FV (left) or fEPSPs (right) in slices from control and. Ablatedim mice (two-way ANOVA p=0.118 and 0.893, n = 9 control slices and 7 Ablatedim slices). (B) There were no differences in vGlut1 expression in the molecular layer between respective controls and BaxKOim mice (left) or Ablatedim mice (right). Top row, 20X images, yellow box shows quantification region, GCL = granule cell layer, MML = middle molecular layer, scale bar = 50 μm. Bottom row, higher magnification image used to measure fluorescence intensity, scale bar = 10 μm. (C) Quantification of corrected total fluorescence intensity (CTFI) showing no difference in the amount of Vglut1 signal between BaxKOim (48,807 ± 2,554, n = 11 images) and control (44,964 ± 1,283, n = 20; unpaired t-test p=0.239) or between Ablatedim (48,247 ± 2,171, n = 13 images) and controls (53,787 ± 1,856, n = 11; unpaired t-test p=0.093).
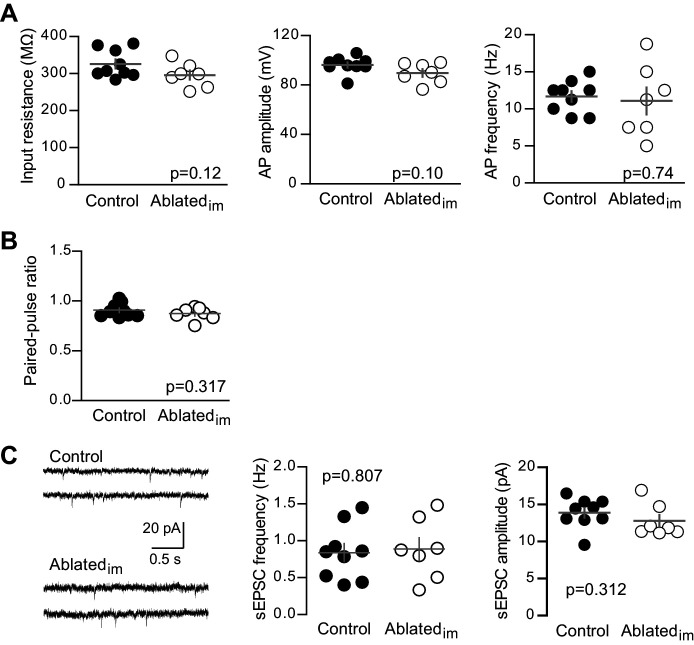
Figure 4—figure supplement 2. Unlabeled GCs in Ablatedim mice have mature intrinsic properties and no change in PPR or sEPSCs.

Figure 4—figure supplement 2.

(A) Intrinsic properties of mature GCs were assayed by current injections (as in Figure 1—figure supplement 2). Intrinsic properties of mature GCs were similar in Ablatedim and control mice, including input resistance (unpaired t-test p=0.12), action potential (AP) amplitude measured from threshold (p=0.10) and AP frequency, measured in response to 50 pA current injections (p=0.74, n = 9 control, 7 Ablatedim). (B) Control and Ablatedim mice had similar PPR when stimulating at a 100 ms interval (unpaired t-test p=0.317, n = 9 control and 7 Ablatedim). (C) Example traces from spontaneous EPSC recordings (left). Both the frequency (middle) and amplitude (right) of spontaneous events was the same in control and Ablatedim mice (unpaired t-tests p=0.807 and 0.312; n = 9 control and 7 Ablatedim).