. 2017 Jan 6;6:e21989. doi: 10.7554/eLife.21989

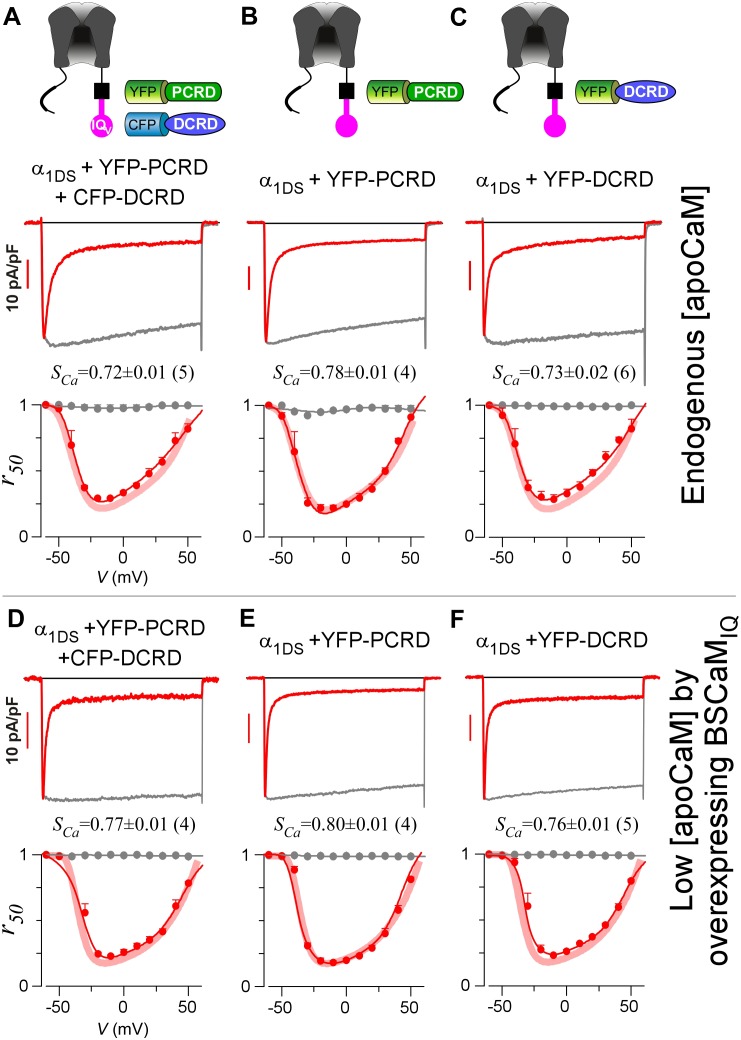
Figure 3. Individual DCRD peptides expressed separately from IQV are unable to induce CMI.

(A) PCRD and DCRD tagged with fluorescent proteins were coexpressed with α1DS as separate peptides. The presence of both YFP-PCRD and CFP-DCRD peptides in the same cell was confirmed under a fluorescence microscope (Figure 3—figure supplement 1). Under normal [apoCaM] in cells, no CMI effect was observed from ICa trace exhibiting CDI similarly as α1DS control, confirmed by comparable SCa values and indistinguishable r50 profiles. (B and C) Experiments and analyses were performed in normal [apoCaM] similarly as (A), except that only YFP-PCRD (B) or only YFP-DCRD (C) was expressed with α1DS channels. Both resulted into strong CDI, with SCa and r50 indistinguishable from α1DS control. (D−F) When free [apoCaM] was substantially reduced by overexpressing BSCaMIQ (apoCaM buffers), the above three cases in (A−C) were re-examined. Exemplar ICa traces exhibited strong CDI as quantified by SCa values and r50 profiles, similarly as the control group of α1DS in low [apoCaM] (semitransparent line in red).

DOI: http://dx.doi.org/10.7554/eLife.21989.007

Figure 3.

Figure 3—figure supplement 1. To confirm the presence of both PCRD and DCRD peptides in single cells.

Figure 3—figure supplement 1.

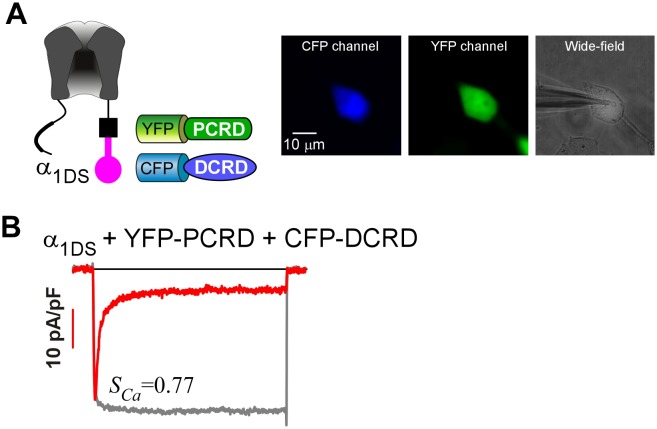
(A) YFP-PCRD and CFP-DCRD were coexpressed with α1DS (left). For one single cell under patch recording (right image), the epi-fluorescence of high intensity via CFP (left image) and YFP (middle image) channels was observed to confirm that both peptides were well expressed. (B) The exemplar recording of ICa from that particular cell in (A) exhibited strong CDI (SCa), within the range of standard SCa for α1DS (0.76 ± 0.02, n = 5).
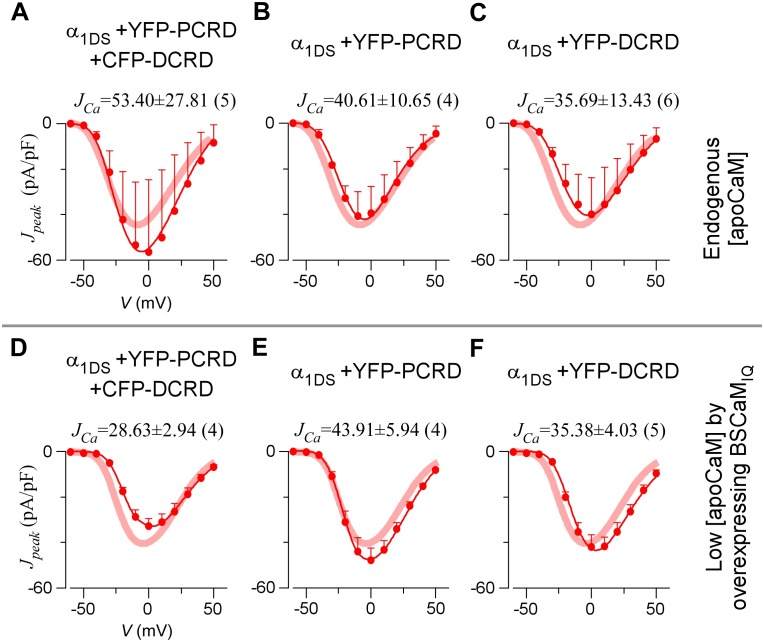
Figure 3—figure supplement 2. PCRD and DCRD as separate peptides are unable to inhibit VGA.

Figure 3—figure supplement 2.

(A–C) In normal [apoCaM], when both PCRD and DCRD were expressed but as separate peptides (A), the VGA profile of α1DS (control, red thick semitransparent lines) was unaltered as indexed by JCa. Similarly, no inhibition of VGA was observed when only PCRD (B) or only DCRD (C) was transfected. (D−F) When [apoCaM] was reduced by overexpressing BSCaMIQ, for all the three cases in (A−C), their VGA profiles were indistinguishable from the control group (red thick semitransparent lines), also confirmed by similar JCa values across different groups.