. 2017 Jan 6;6:e21989. doi: 10.7554/eLife.21989

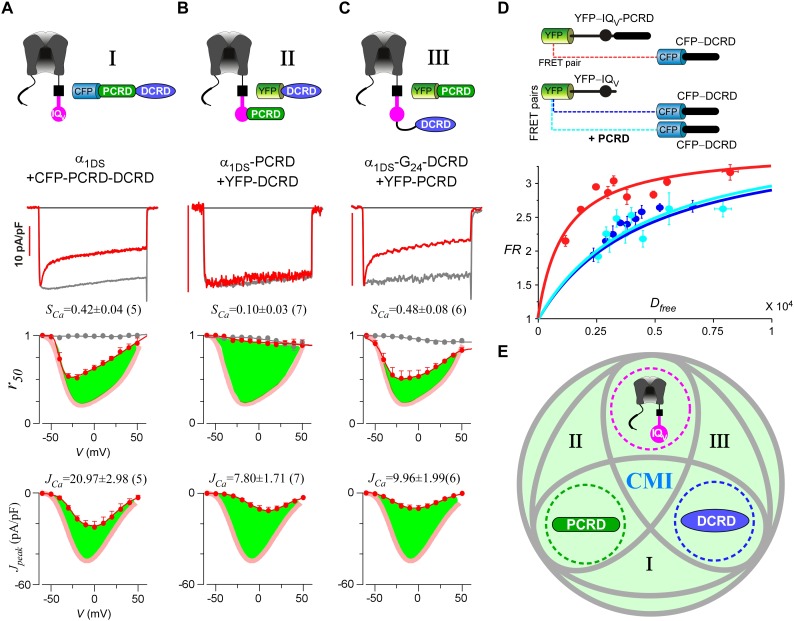
Figure 4. Cooperation by PCRD, DCRD and IQV to induce CMI.

(A) Both CDI and VGA of α1DS channels were attenuated by pre-linked PCRD-DCRD illustrated in the scheme (top), shown in the exemplar traces (middle) and voltage-dependent r50 and Jpeak profiles (lower two panels). The potency of CMI was indexed by SCa and JCa values and also illustrated by the green areas. Profiles of α1DS control were indicated by thick semitransparent lines in red (lower two panels). (B) Both CDI and VGA of α1DS-PCRD were strongly prohibited by DCRD. (C) Both CDI and VGA of α1DS-G24-DCRD were attenuated by PCRD. (D) FRET 2-hybrid assays demonstrated that pre-linked IQV-PCRD motif (YFP tagged) exhibited strong binding with CFP-DCRD, with higher binding affinity (Kd = 1135, units in donor-cube fluorescence intensity) than the binding affinity (Kd = 4700) between CFP-DCRD and YFP-IQV itself (without PCRD being fused). Additional PCRD peptides did not make any appreciable change (Kd = 4624) for the binding between CFP-DCRD and YFP-IQV, unable to rescue the low affinity back to the high level that the constitutive PCRD fusion (YFP-IQV-PCRD) could achieve. FRmax values for all these binding curves were similar (3.50—3.87). Each data point represented the FR (y-axis, FRET ratio) and Dfree (x-axis, free donor concentration) values averaged over five adjacent individual cells sorted by Dfree. (E) Working model to illustrate the collaboration among three components of PCRD, DCRD and IQV (embedded within α1DS) for CMI induction. Grey circles represent the effective combinations, which require that at least two (out of three) components are closely engaged (e.g., fusion) to form the trio complex incorporating the third (separate) component. The three key combinations are I (IQV+PCRD-DCRD), II (IQV-PCRD+DCRD) and III (IQV-DCRD+PCRD), where ‘–’ denotes fusion or spatial closeness and ‘+’ indicates the separate peptide to be coexpressed. In addition, the positive control (IQV-PCRD-DCRD) also represents the native long variant α1DL; and the three components (dotted circles in green, pink and blue) completely separate to each other (IQV+PCRD+DCRD) produce no CMI effect, serving as one negative control.

DOI: http://dx.doi.org/10.7554/eLife.21989.010

Figure 4.

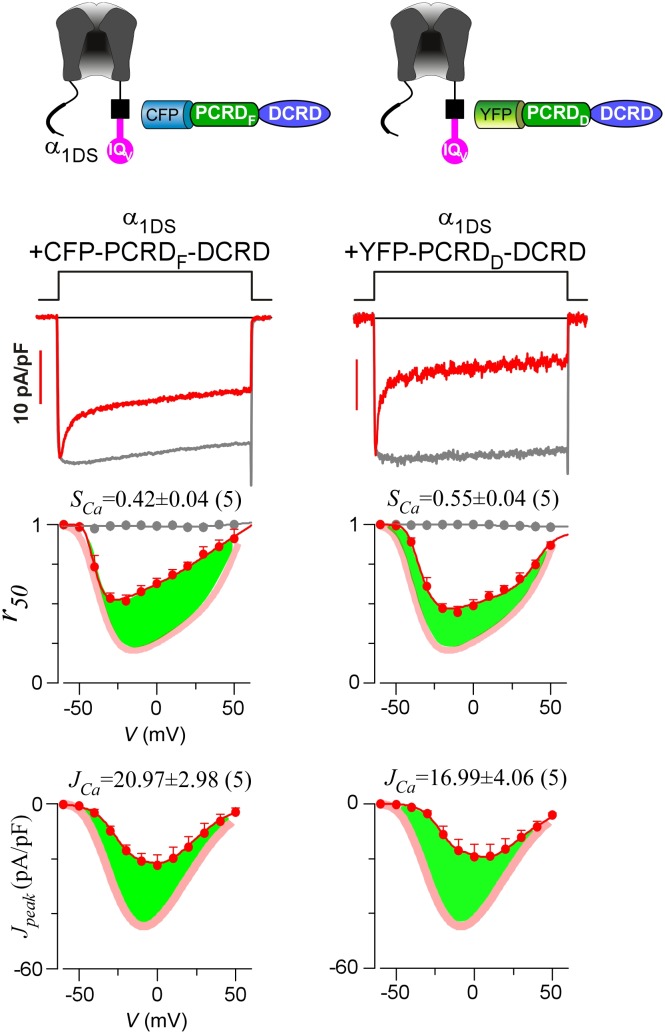
Figure 4—figure supplement 1. Functional similarities between PCRDF and PCRDD.

Figure 4—figure supplement 1.

The pronounced CDI (SCa) and strong VGA (JCa) of α1DS channels (indicated by red thick semitransparent lines in r50 and Jpeak plots) were similarly attenuated by PCRD-DCRD peptides made from either PCRDF from CaV1.4 (left column) or PCRDD from CaV1.3 (right column). Representative ICa traces (top), CDI and VGA profiles (panels in the two bottom rows) across the full voltage range were shown for the two types of peptides, with no significant difference. Green areas represent the potency of attenuation, supporting that PCRDF and PCRDD were interchangeable for CMI in this study as we assumed.
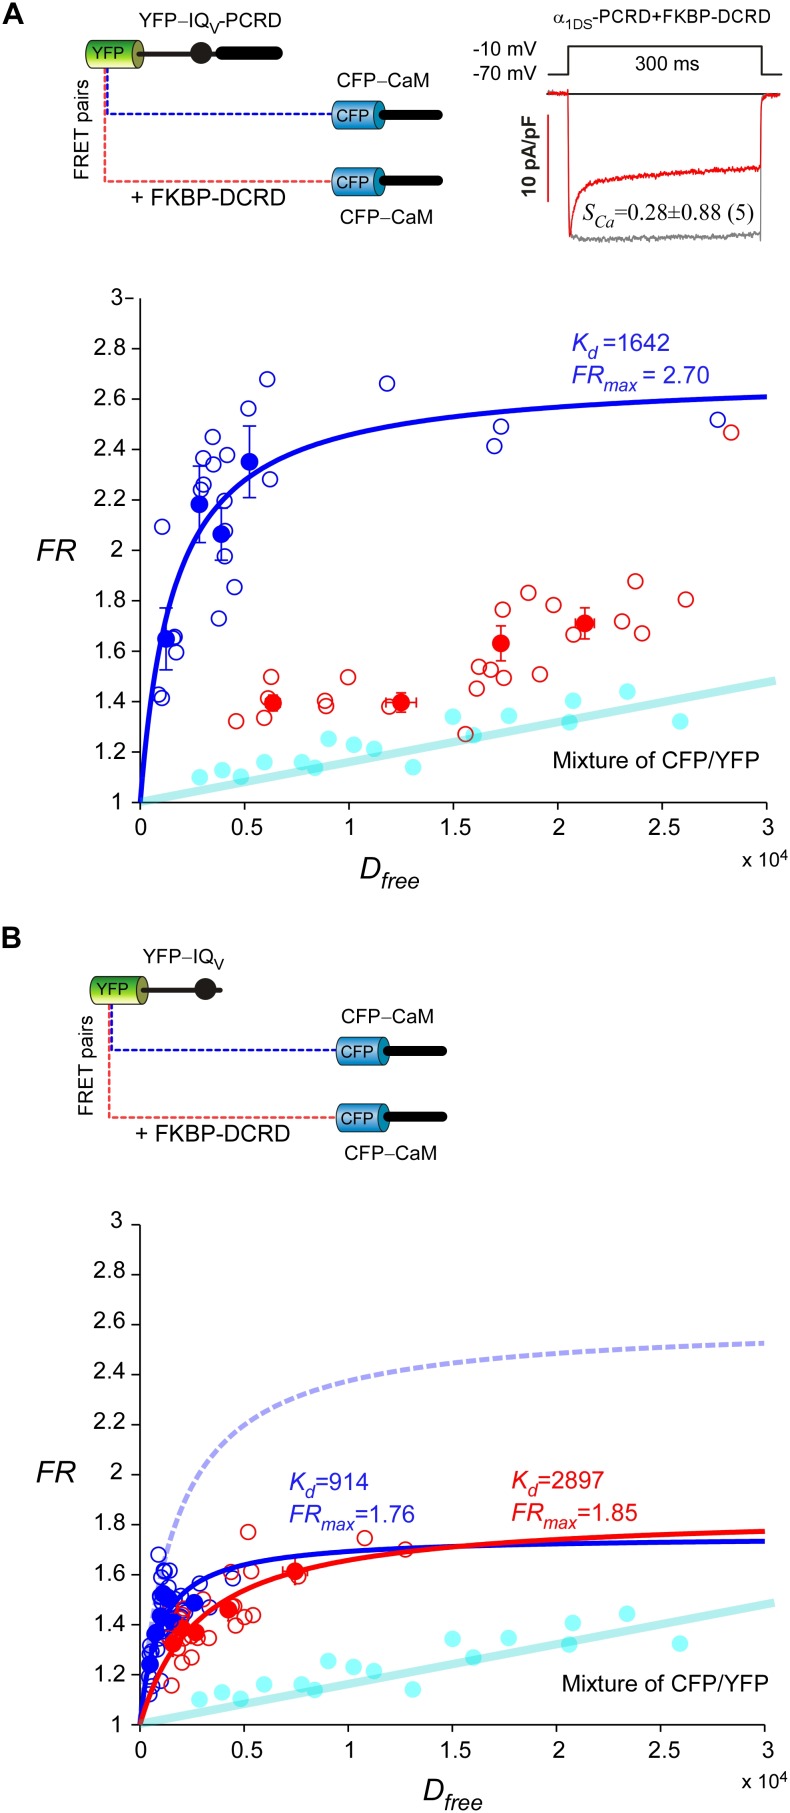
Figure 4—figure supplement 2. Cooperative perturbation of apoCaM/IQV binding by DCRD and PCRD.

Figure 4—figure supplement 2.

(A) By 2-hybrid FRET with the CFP- or YFP-labeled constructs illustrated on top, IQV-PCRD (YFP-tagged) and CaM (CFP-tagged, apo-state) exhibited strong binding (blue), quantified by the maximum FRET ratio (FRmax) and effective equilibrium dissociation constant (Kd) from iterative curve fitting. The values of FRmax and Kd were indicated right above the fitted curves (in the same color) when applicable. Unfilled-dots and filled-dots represent individual cells and averaged results (over five cells) respectively. The binding between apoCaM and IQV-PCRD were severely perturbed by FKBP-DCRD (with FKBP tag adopted from subsequent rapamycin-inducible CMI, but without fluorescent tags of CFP/YFP), resulted into the data points (red) approaching the baseline of CFP/YFP mixture (cyan), indicative of very weak Kd. The perturbation was presumably by way of the close cooperation between FKBP-DCRD and IQV-PCRD to compete against apoCaM. The FRET binding analyses were consistent with the patch-clamp recordings confirming that CDI (SCa) of α1DS-PCRD was attenuated in the presence of FKBP-DCRD (inset). (B) In the absence of PCRD, the perturbation by FKBP-DCRD was much less effective. Without the presence of PCRD, CFP-CaM and YFP-IQV (blue) were still able to bind. However, in contrast to the strong perturbation seen in (A), in the absence of PCRD, inclusion of DCRD peptides made no or very little difference in Kd and FRmaxvalues for CaM and IQV. The binding curve (dotted line in light blue) was replicated from CFP-CaM and YFP-IQV-PCRD (A) for comparison.