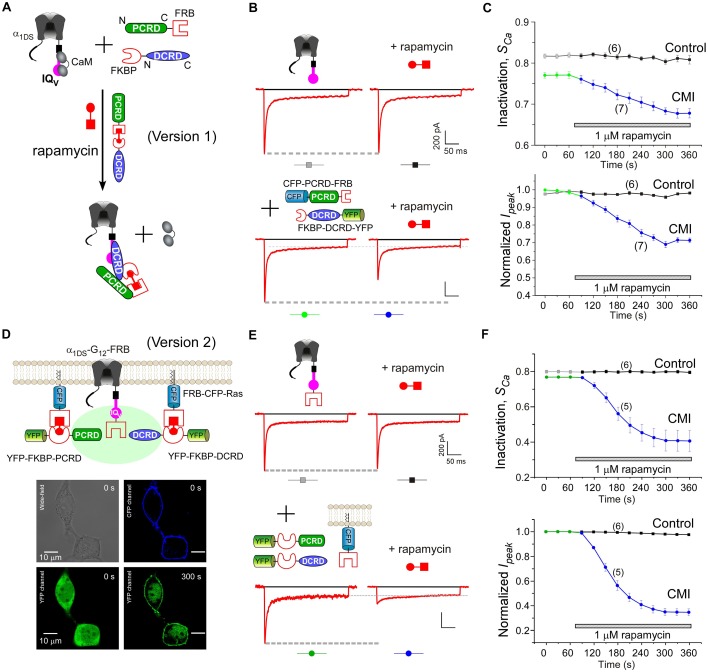
Figure 5. Design schemes and experimental implementations of rapamycin-inducible CMI.
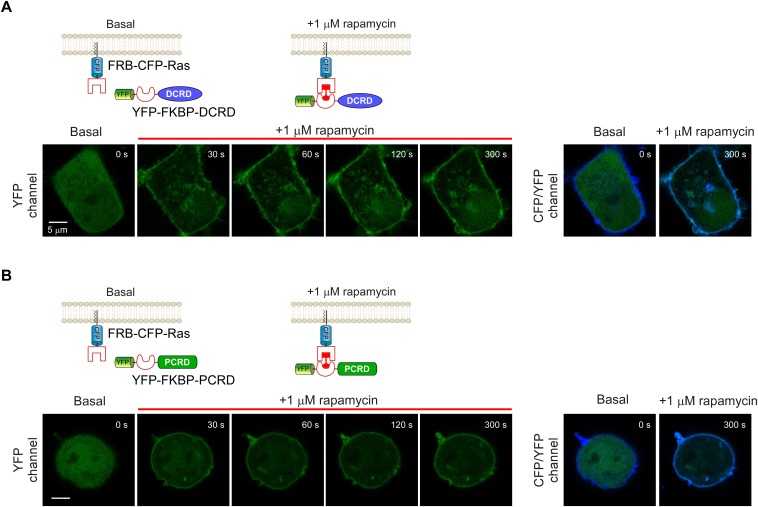
(A) Design principles for chemical-inducible CMI. Rapamycin simultaneously binds one FKBP and one FRB to combine any two FRB/FKBP-tagged components (PCRD and DCRD, in this version 1) selected from the three components of PCRD, DCRD and IQV. Thus, the three components would form the combinations (combination I, in the version 1) to satisfy the requirement of cooperative CMI (Figure 4E). (B) One representative implementation of chemical-inducible CMI. According to the design of version one in (A), PCRD-FRB and FKBP-DCRD were constructed and coexpressed with α1DS. Exemplars of Ca2+ current traces demonstrated that acute effects were induced by applying 1 μM rapamycin to the multi-component system of version 1 (lower panel), in contrast to α1DS control with no appreciable changes in ICa (upper panel). (C) Statistical summary of rapamycin-induced CMI (version 1). Averaged values over multiple cells (number indicated in parentheses) for the indices SCa (upper) or normalized Ipeak (lower) demonstrated time-dependent attenuations on both CDI and VGA upon rapamycin application as compared to the control group. (D) Rapamycin perfusion induced rapid translocation of YFP-FKBP-DCRD or YFP-FKBP-PCRD (version 2) onto the membrane by linking with FRB-CFP-Ras within 5 min, shown by confocal images via wide-field, CFP, and YFP channels. The local concentrations of YFP-FKBP-DCRD and YFP-FKBP-PCRD were substantially enhanced as suggested by the condensed YFP fluorescence at the membrane (outlined by CFP fluorescence). (E and F) According to rapamycin-inducible CMI of version 2, recombinant channels of α1DS-G12-FRB were coexpressed with cytosolic YFP-FKBP-PCRD and YFP-FKBP-DCRD. To enhance local concentrations of FKBP-tagged peptides near the channels, membrane-localized FRB-CFP-Ras was also overexpressed. Exemplars of Ca2+ current traces (E) exhibited strong attenuation (lower), in contrast to stable ICa from α1DS-G12-FRB alone (upper). In contrast to the control group, temporal profiles of rapamycin-inducible CMI (version 2) indicated strong attenuations on CDI (SCa, upper) and VGA (normalized Ipeak, lower). Based on totally five trials (cells), SCa changed from 0.77 ± 0.00 to 0.41 ± 0.06 and Ipeak was reduced to 35% ± 3% of the basal levels (F).


