. 2017 Jan 6;6:e21989. doi: 10.7554/eLife.21989

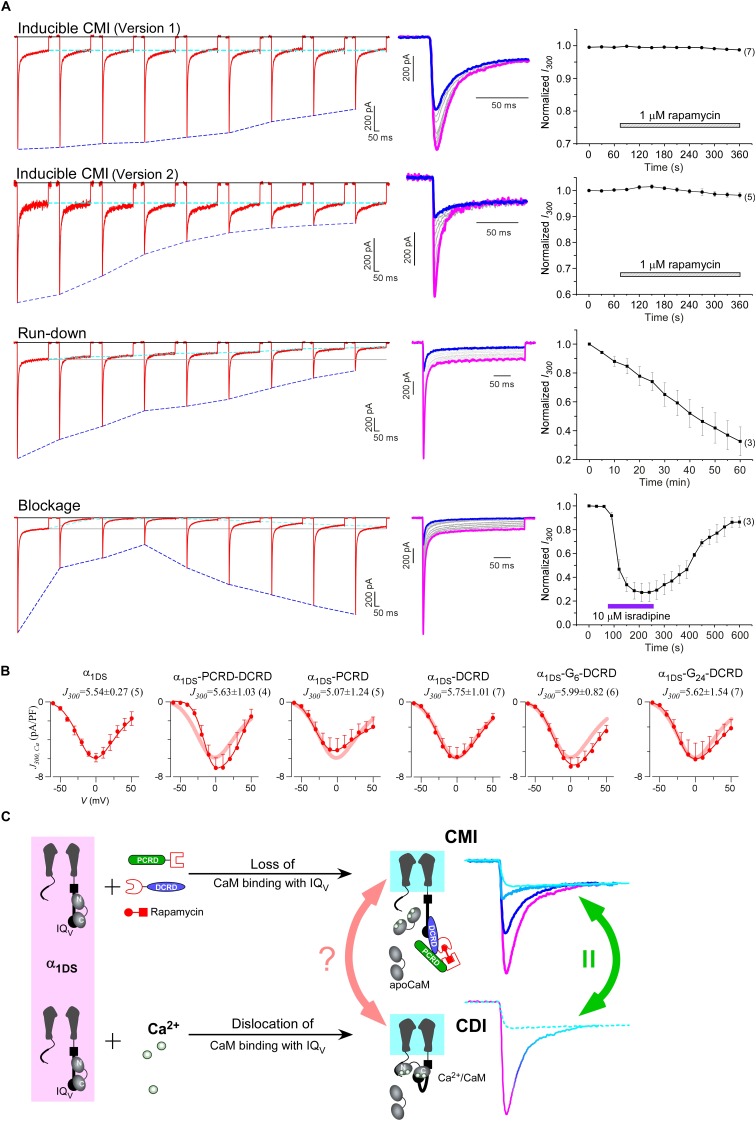
Figure 6. Mechanistic insights enlightened by unique features of CMI.

(A) Temporal profiles between CMI and conventional inhibitions were compared. For rapamycin-inducible CMI (two versions in the top two rows of panels), representative Ca2+ current traces in rapamycin were selected from sequential time-points (left column) and superimposed together (middle column) for comparison. The time sequence was indicated by color: the first in pink, intermediate in grey, and the last in blue. Ipeak exhibited the trend of inhibition but not for I300 (ICa at 300 ms) (right column). In contrast, for run-down process and isradipine blockage (bottom two rows), both Ipeak and I300 exhibited the declining trends indicating substantial inhibitions. (B) Ca2+ current density at 300 ms (J300,Ca) remained at the same level (indicated by the J300 values at −10 mV), for various channel variants under test, regardless of whether CMI was in effect. Thick lines (semitransparent in red) represent the J300,Ca profile of α1DS control. (C) Functional and the structural insights into the two modes of inhibition. DCT/apoCaM-dependent CMI and Ca2+/CaM-mediated CDI result in indistinguishable gating (green arrows) appearing due to similar causes, i.e., either total or partial loss of the apo-state CaM/IQV complex. That says, in CMI, apoCaM pre-association is totally lost; and in CDI, apoCaM is calcified and dislocated from the pre-association sites. Although the triggers are different for CMI vs CDI, i.e., DCT competing (off apoCaM) vs Ca2+ binding (onto apoCaM), the similarities between the two different inhibitory regulations of CMI and CDI invite the hypothesis that the core gating machinery (cyan squares) upon depolarization might step into the same scenario/mode including structural details (red arrows). A series of current traces (on the right) indicate CMI with different potency (enhanced from pink to cyan, upper), in comparison with the trace at different stages of CDI (developed from pink to cyan, lower) superimposed with the trace from ultrastrong CMI (dotted trace in cyan). These analyses point to one important notion that the lower limit of CMI is determined by end-stage CDI (the traces or the phases in cyan), and thus the dynamic changes for CMI effects on α1DS (indexed with Ipeak and SCa) are preset, i.e., from the pink (no CMI and ultrastrong CDI) to the cyan (ultrastrong CMI and no CDI).

DOI: http://dx.doi.org/10.7554/eLife.21989.016

Figure 6.

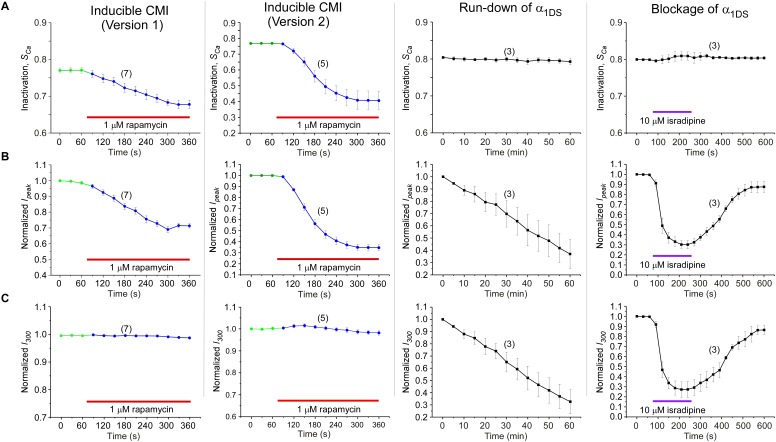
Figure 6—figure supplement 1. Detailed comparisons among CMI, run-down and blockage.

Figure 6—figure supplement 1.

CMI was compared with conventional inhibitions/inhibitors including channel blockage (by isradipine) and run-down process (reduction of channel numbers), indexed with SCa, Ipeak and I300. Both rapamycin-induced CMI and run-down/blockage exhibited time-dependent decreases in Ipeak, as expected from effective ICa inhibitions (B). In contrast, CDI (SCa) did not change in run-down/blockage; whereas for CMI SCa exhibited rapamycin-dependent attenuation, similar to Ipeak (A). Moreover, the plateau of ICa (I300) remained constant in spite of Ipeak attenuation in CMI, whereas I300 changed (decreased or recovered) in a similar time-course to that of Ipeak during run-down and blockage (C). Since SCa is in proportion to Ipeak/I300, the two major types of inhibitions (CMI vs conventional inhibitions) were distinct within this context: for CMI, both Ipeak and SCa changed but with I300 being kept constant; in contrast, for conventional inhibitions, both Ipeak and I300 changed, but SCa remained unaltered.
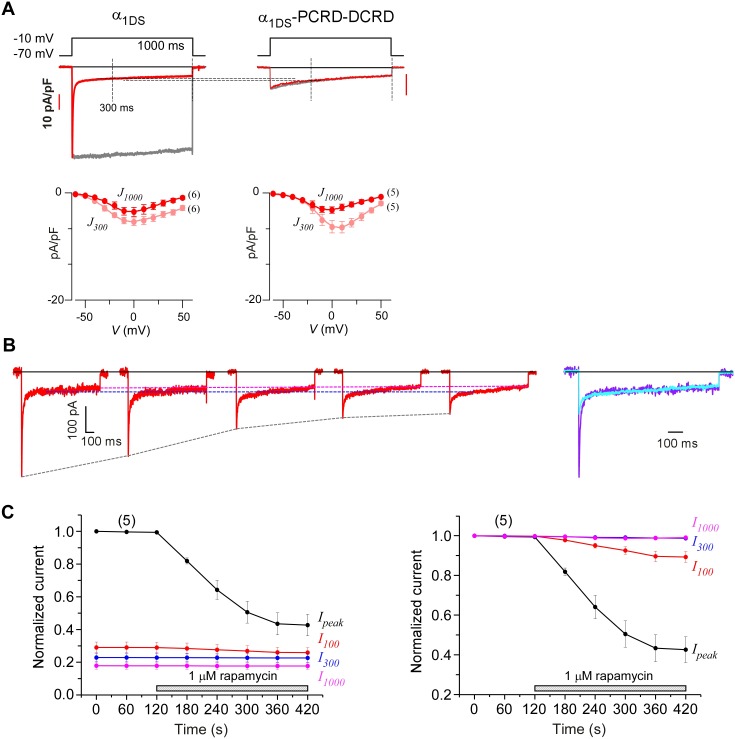
Figure 6—figure supplement 2. Indices at different time points of ICa to quantify CMI and end-stage CDI.

Figure 6—figure supplement 2.

(A) Analyses at both 300 ms and 1000 ms were able to reliably unveil that channels subject to CMI were essentially tuned to approach ICa levels in end-stage CDI. Upper panel, we set I1000 (ICa at 1000 ms) of both exemplar traces to the same level for α1DS and α1DS-PCRD-DCRD (in principle, they should be the same); and the levels of ICa at 300 ms (I300) turned out to be nearly the same, similarly as the analyses with I1000. At 300 ms, the kinetic difference between IBa (normalized to the peak of ICa) and ICa was very little, indicative of end-stage CDI (upper right). Full profiles of Ca2+ current density (indexed with J300 or J1000) were indistinguishable for both groups of α1DS and α1DS-PCRD-DCRD, further supporting that both are qualified as reliable indices for CMI analysis. (B) For rapamycin-inducible CMI (version 2) by supplying PCRD, DCRD and α1DS with membrane-targeting and rapamycin-inducible mechanisms, representative ICa traces were selected from sequential time-points (left), and the first (purple) and the last (cyan) traces were superimposed together for comparison (right). Ipeak exhibited a trend of time-dependent decrease; meanwhile, both I300 and I1000 remained rather constant (dotted outlines in black, blue and pink respectively). (C) Statistical summary of ICa amplitudes for rapamycin-induced CMI (version 2). ICa values were measured at different time points, i.e., Ipeak, I100, I300 and I1000, each of which was either rescaled to Ipeak (left) or to its own (right). Ipeak exhibited robust inhibition due to CMI, and a trend of moderate decline (right) was noticeable from I100 (ICa at 100 ms); whereas I300 and I1000 clearly remained constant throughout the full time-course, thus reliably representing the end stage or steady state of CDI. In line with our previous analyses, the current level of I300 or I1000 determined the lower limit of ICa (measured by Ipeak) subject to CMI of the maximum potency.
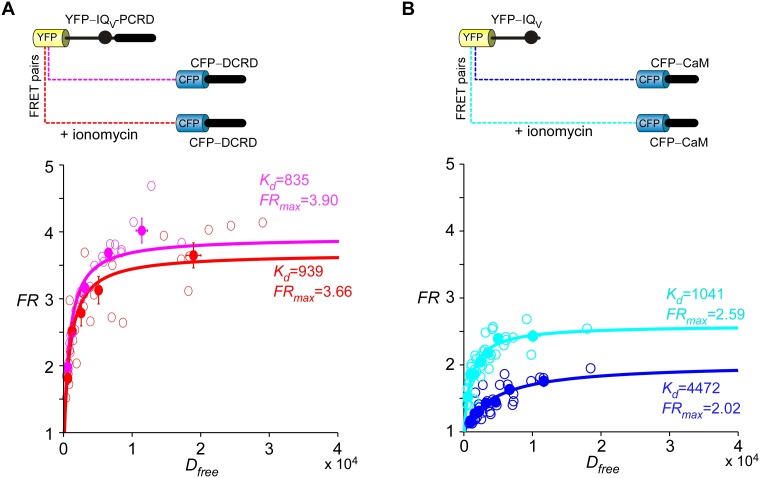
Figure 6—figure supplement 3. The high-affinity binding between DCRD and the channel was not perturbed by Ca2+/CaM.

Figure 6—figure supplement 3.

(A) Upon applying ionomycin, an ionophore massively raising intracellular Ca2+ levels, endogenous CaM should switch from Ca2+-free state (apoCaM) to Ca2+-bound state (Ca2+/CaM). However, similar Kd values were obtained by fitting the FRET binding curves before and after ionomycin application (pink, before ionomycin; red, in ionomycin), indicating that Ca2+/CaM was unable to perturb the strong binding between DCRD and IQV-PCRD. In the FR-Dfree plots, unfilled-dots and filled-dots represent individual cells and averaged results (over five cells) respectively. (B) Following ionomycin administration, the indices (Kd and FRmax) of the binding between CaM and IQV were clearly strengthened consistent with the IQV/CaM interactions previously established.