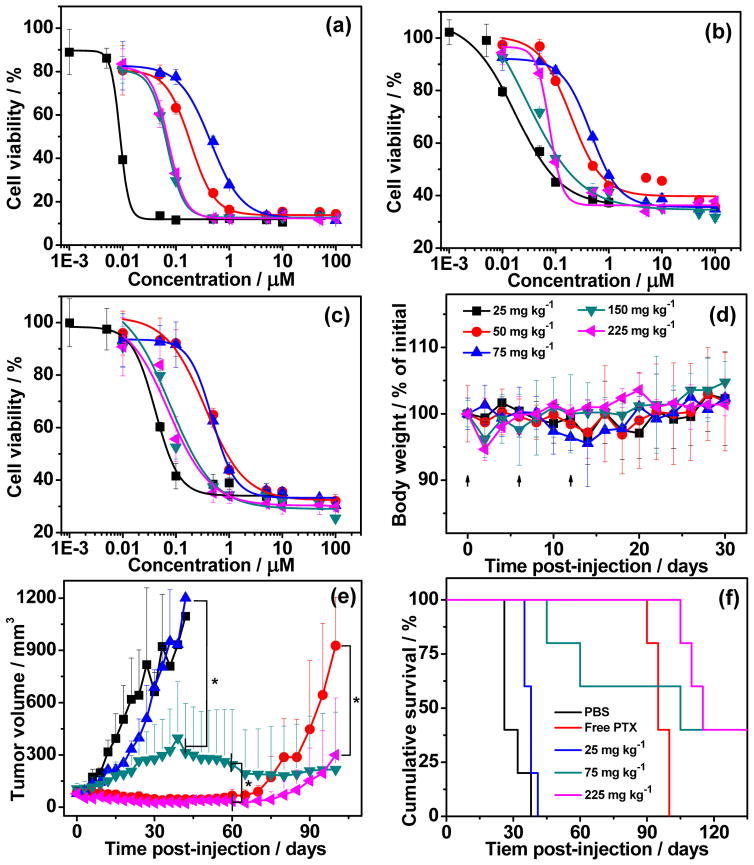
Figure 2.
Cell viability of free PTX (■), mPEG-poly(TMC-PTX1.4) (
 ), mPEG-poly(TMC-PTX2.7) (
 ), mPEG-polyPTX5.8 (
 ) and mPEG-polyPTX8.7 (
 ) against (a) HT-29, (b) MDA-MB-231 and (c) PANC-1 cells, respectively. The cells were incubated for 72 h and the cell viability (in %) is normalized against untreated cells in the same experiment. (d) Plot of mean body weight change of mice with a dose escalation trial of mPEG-PPTX8.7 as a function of time. Points represent the mean ± SD (n=3 to 4). (e) Tumour volume up to day 100 (mean ± SD; n = 5). PBS (■), 25 mg kg−1 of free PTX (
 ), and mPEG-PPTX8.7 at dose of 25 (
 ), 75 (
 ), and 225 (
 ) mg PTX equivalent per kilogram BW were systemically administered via intravenous tail vein injection on day 0, 6 and 12, respectively. * indicates P < 0.001 (One-tailed heteroscedastic t-test). (f) Cumulative survival of mice (Kaplan–Meier).

