Figure 1.
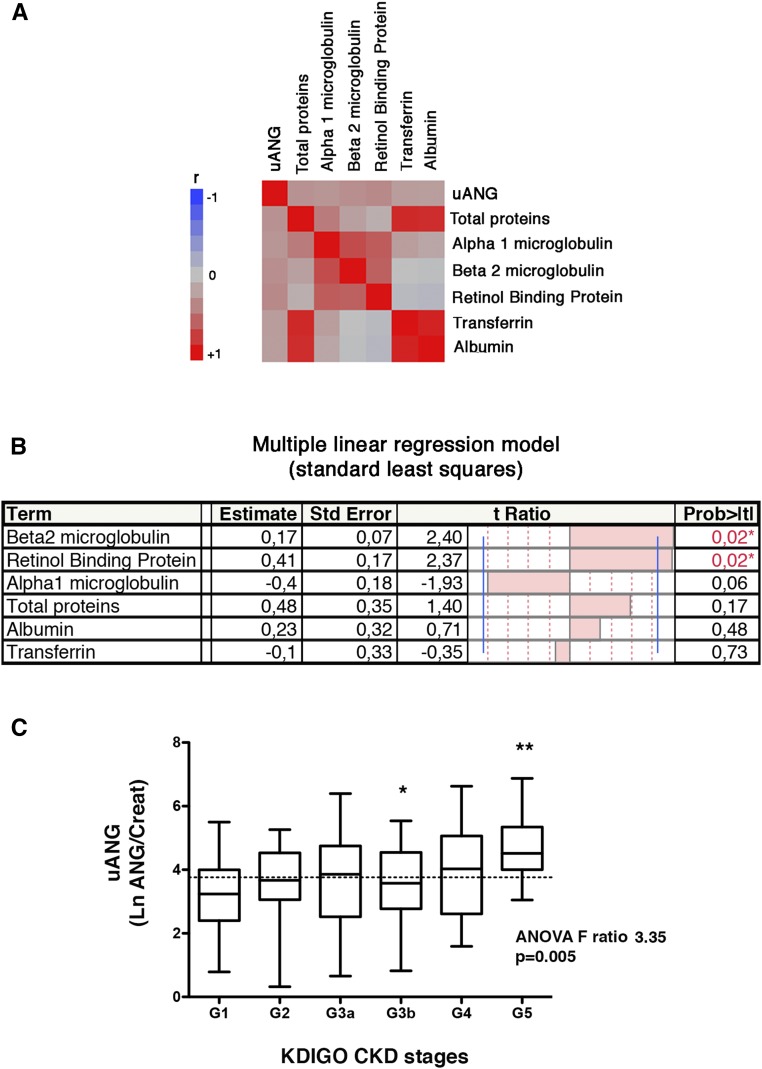
Biochemical characterization of uANG. (A) Multivariate correlation matrix between uANG, proteinuria, albuminuria, urine transferrin, β2-microglobulin, α1-microglobulin, and retinol binding protein in a cohort of 192 individuals under investigation for CKD. All variables were reported by the value of urine creatinine. (B) Multiple linear regression analysis (standard least squares model) between uANG and proteinuria, albuminuria, urine transferrin, β2-microglobulin, α1-microglobulin, and urinary retinol binding protein as explanatory variables in the cohort of 192 individuals under investigation for CKD. All variables were reported to the value of urine creatinine. Estimate values give the estimate of the model coefficients for each term. The t ratio is the ratio of the estimate to its SEM, and it tests whether the true value of the parameter is zero. (C) Distribution of uANG (log transformation of uANG/creatinine) according to Kidney Disease Improving Global Outcomes (KDIGO) CKD stages (G1: eGFR>90 ml/min per 1.73 m2; G2: eGFR=60–90 ml/min per 1.73 m2; G3a: eGFR=45–59 ml/min per 1.73 m2; G3b: eGFR=30–44 ml/min per 1.73 m2; G4: eGFR=29–15 ml/min per 1.73 m2; and G5: eGFR<15 ml/min per 1.73 m2). *P<0.05 (G3b versus G5; Bonferroni multiple comparison test); **P<0.05 (G1 versus G5; Bonferroni multiple comparison test).

