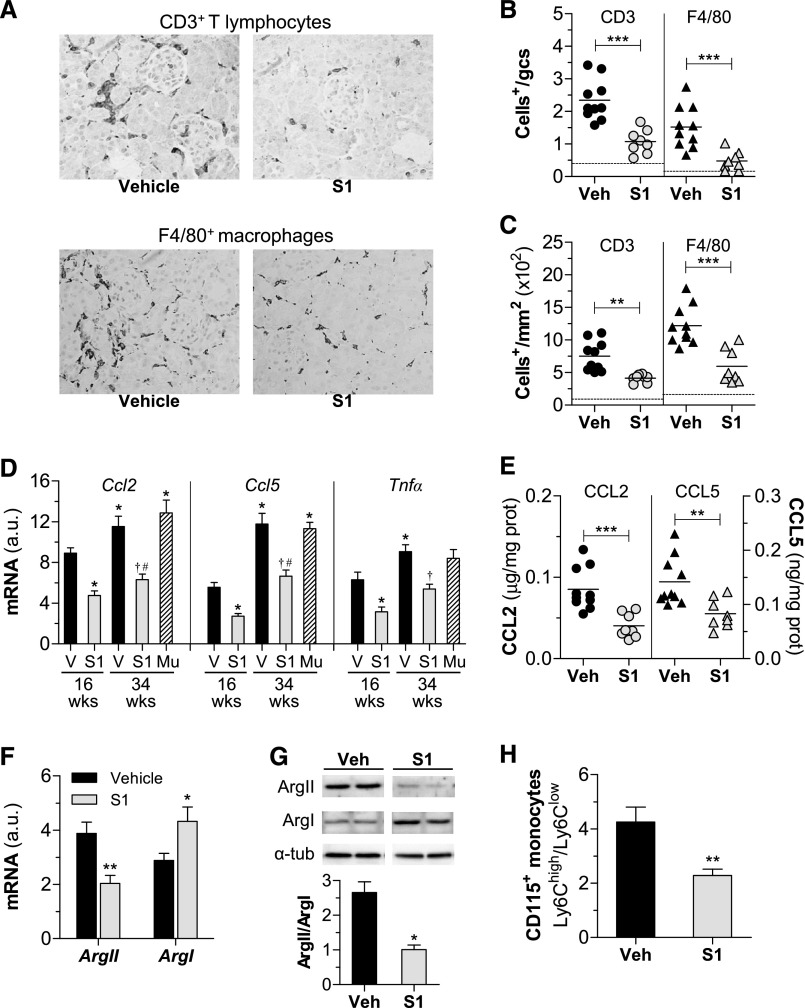
Figure 4.
SOCS1 peptide decreases inflammation in diabetic mice. (A–C) Histologic analysis of T lymphocytes and macrophages in kidney sections from diabetic mice (early model). (A) Representative micrographs. Quantification of CD3+ and F4/80+ cells in glomeruli (B) and interstitium (C). Horizontal dotted lines represent the mean values for nondiabetic mice. (D) Real-time PCR analysis of inflammatory genes in renal cortex. Normalized values are expressed in arbitrary units (a.u.). (E) Kidney chemokine levels measured by ELISA. (F) Gene expression levels of arginase isoforms (ArgII and ArgI) in diabetic kidneys. Real-time PCR data normalized by 18S are expressed in a.u. (G) Representative immunoblots and summary of the relative levels of ArgII and ArgI protein expression in renal lysates from diabetic mice. (H) Flow cytometry analysis of relative CD115+ monocyte population (Ly6Chigh and Ly6Clow) in peripheral blood. Bars represent the mean±SEM of 5–10 animals per group. Veh/V, vehicle. *P<0.05, **P<0.01, and ***P<0.001 versus Veh (16 weeks); †P<0.05 versus Veh (34 weeks); #P<0.05 versus Mu. Original magnification, ×200 in A.

