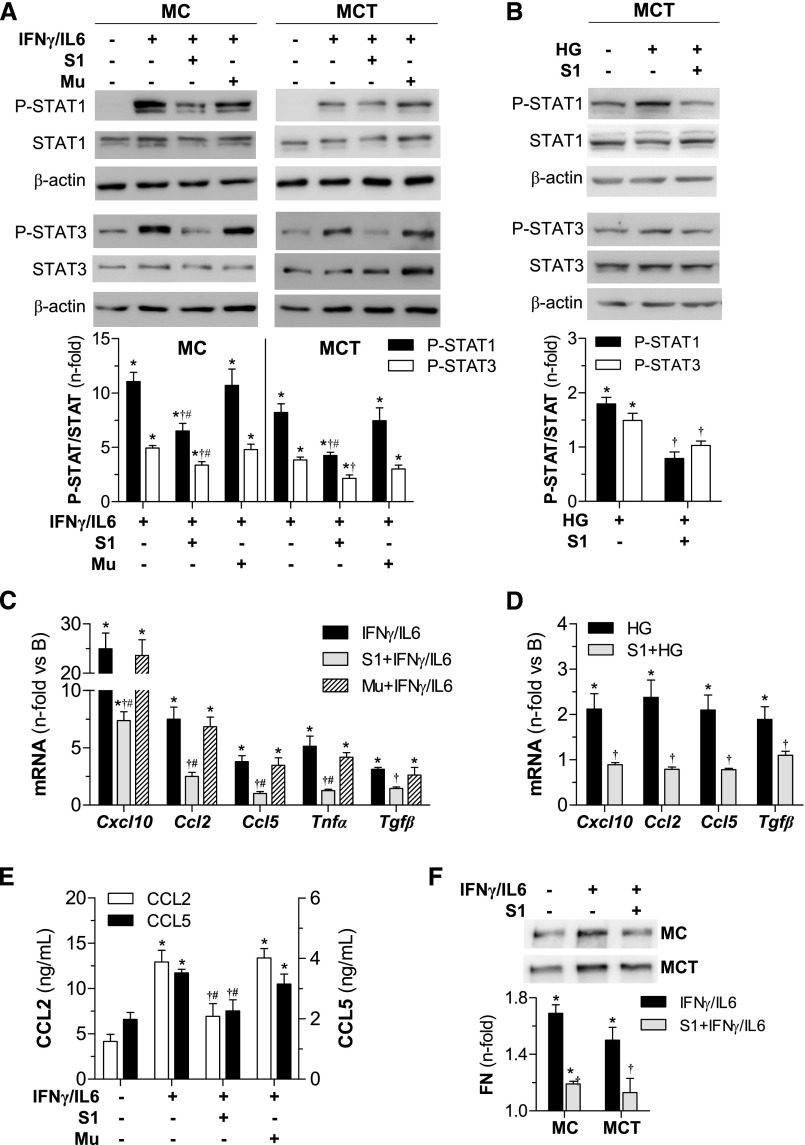
Figure 5.
SOCS1 peptide inhibits STAT activation and target gene expression in vitro. Western blot analysis for P-STAT1 and P-STAT3 proteins in total cell extracts from MC and MCT stimulated with cytokines (60 minutes) (A) and HG (6 hours) (B) in the presence or absence of peptides (100 μg/ml). Representative immunoblots are shown and densitometry data expressed as fold increases over basal conditions (arbitrarily set to 1). Real-time PCR analysis of indicated genes in MCT at 24 hours of stimulation with cytokines (C) and HG (D). (E) CCL2 and CCL5 concentrations in MC supernatants measured by ELISA. (F) Western blot of fibronectin (FN) levels in culture supernatants. Bars represent the mean±SEM of 4–7 independent experiments. *P<0.05 versus basal; †P<0.05 versus stimulus; #P<0.05 versus Mu.

