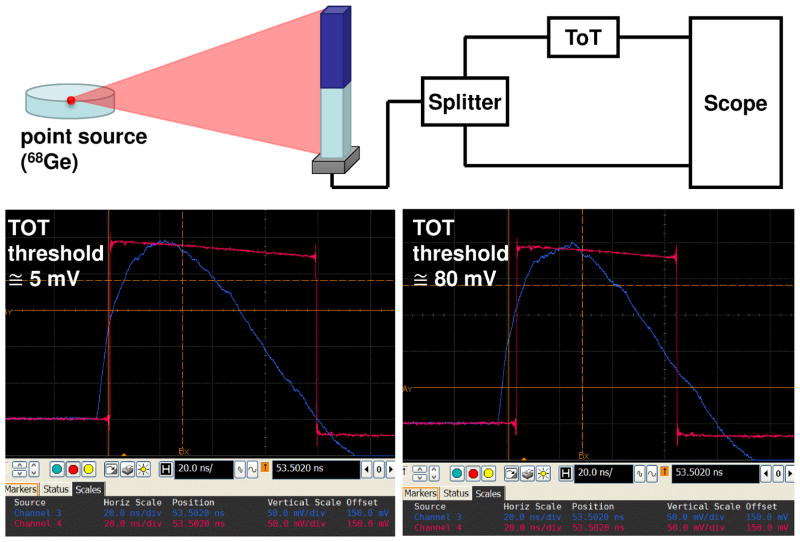
Figure 3.
(Top) Schematics of the detector readout with a ToT circuit. The ToT circuit includes a comparator with an adjustable threshold voltage. (Bottom) Oscilloscope screenshots of the acquired waveform from the output of the SiPM readout and the ToT board with two different threshold settings: 5 mV (left) and 80 mV (right).

