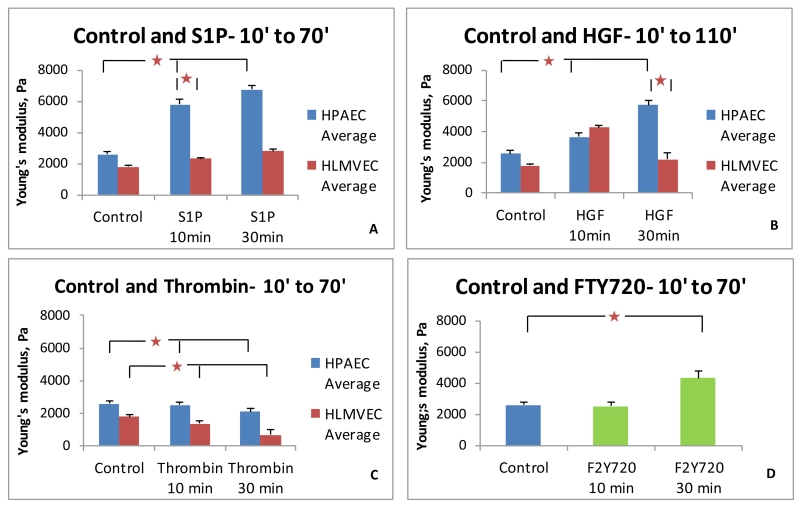
FIGURE 3.
Comparison of the peripheral Elastic modulus values for HPAEC and HLMVEC in response to barrier-regulatory agonists. (A) S1P produces an increase in Young’s modulus in both cell types, but the magnitude is lower in HLMVEC. (B) HGF stimulation demonstrated similar trends as S1P for HPAEC but at a lower absolute magnitude. HLMVEC demonstrated an earlier peak in magnitude compared to S1P. (C) Thrombin decreases peripheral elastic modulus values in both cell types. (D) FTY720 increases the elastic modulus in HPAEC in the 30 minute group. (* p < 0.05 between indicated conditions. 40 cells per condition).

