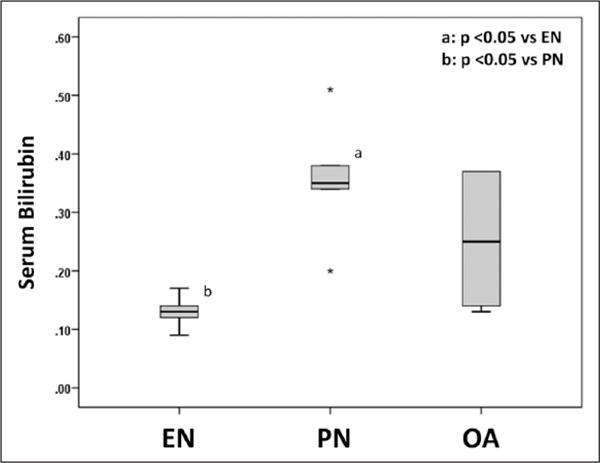
Figure 5.

Serum bilirubin level is shown as a box and whisker plot. Boxes represent the 25th–75th percentile; central lines represent median values. Whiskers extend to a maximum of 1.5 times the interquartile range. If there are no whiskers, then the data point is within the interquartile range. Stars represent outlier observations, beyond 3 times the interquartile range from the edge of the box. A Kruskal-Wallis test and subsequent pairwise Mann-Whitney U test were conducted to determine P value. All tests were 2-sided with a significance level of 0.05. Note significant elevation in bilirubin with parenteral nutrition (PN). EN, enteral nutrition; OA, oleanolic acid.
