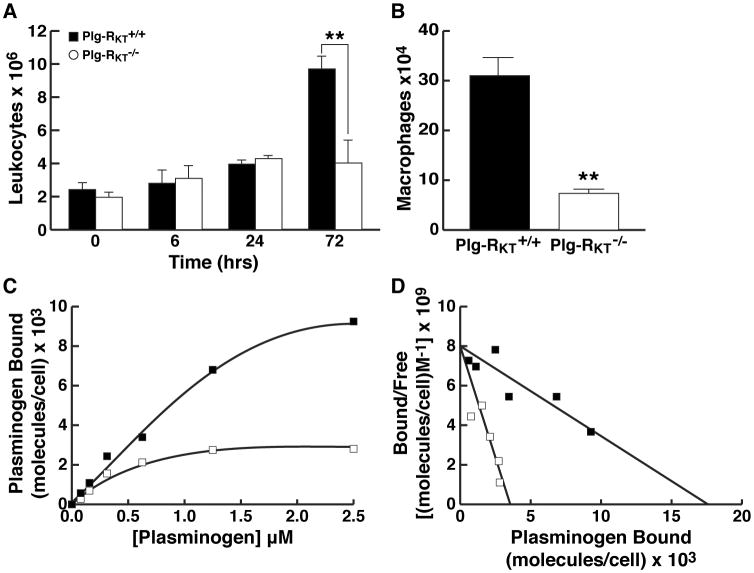
Figure 3. Plg-RKT Null Mice Exhibit Deficient Macrophage Recruitment and Plasminogen Binding.
(A) Plg-RKT-/- and Plg-RKT+/+ sex matched mice (12 to 14 weeks of age) were injected intraperitoneally with 4% thioglycollate. At specific time points, mice were killed and peritoneal leukocytes were collected by peritoneal lavage with PBS (7 ml). Then 5 ml were centrifuged and resuspended in 50 μl PBS and counted. **P<0.01, by unpaired t test, n=5 Plg-RKT-/- mice and 6 Plg-RKT+/+ mice. Protein concentrations in peritoneal exudates were 1.17 ±0.03 and 0.115 ± 0.015 μg/ml for Plg-RKT+/+ mice and Plg-RKT-/- mice, respectively. P=0.0001, consistent with differences in cellular content. (B) Macrophages were isolated by plating leukocytes onto tissue culture dishes and harvesting adherent cells after 72 hr. **P<0.01, by unpaired t test, n= n=5 Plg-RKT-/- mice and 6 Plg-RKT+/+ mice. (C) Specific binding isotherms for the interaction of plasminogen with Plg-RKT+/+ and Plg-RKT-/- macrophages. Plg-RKT-/- and Plg-RKT+/+ mice (3 of each genotype) were injected separately with thioglycollate. Peritoneal leukocytes were harvested 72 hr later and cells from each genotype were pooled. Quantitative flow cytometric equilibrium binding of FITC-Glu-plasminogen to peritoneal leukocytes was analyzed using beads impregnated with FITC as described [6]. Macrophages were identified by their distinct forward scatter/side scatter properties and annexin V was used to gate for cells that were not apoptotic (i.e., did not express phosphatidyl serine, which binds annexin V, on their surfaces). Specific binding of FITC-plasminogen to the cells was calculated by subtracting binding in the presence of 0.2 M EACA (non-specific binding) from total binding. Quantitative flow cytometric equilibrium binding of FITC-plasminogen to cells was analyzed as described. [6] (D) Scatchard plots of data shown in panel C were determined using the single site binding equation [LR]=([L]Bmax)/([L]+Kd). Binding parameters were determined using the program, NLREG, version 6.5. Data are representative of 3 experiments. ■ = Plg-RKT+/+ and □ = Plg-RKT-/- macrophages.

