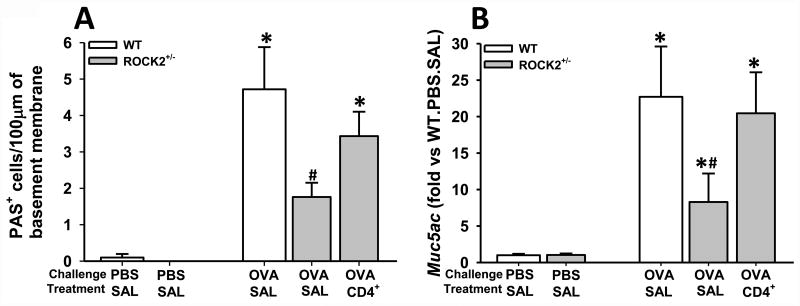
Figure 4.
Regulation of goblet cell hyperplasia by ROCK2. (A) PAS+ cell density (expressed as the number of PAS+ cells per 100 um of basement membrane) quantified morphometrically and (B) pulmonary mRNA abundance of Muc5ac and in WT and ROCK2+/- mice that were sensitized with OVA and challenged with either aerosolized OVA or PBS. WT mice were treated with saline and ROCK2+/- mice were treated with either saline (SAL) or splenic CD4+ cells from OT-II mice (CD4+) as described in Fig.1A. Results are mean ± SEM of 3 PBS challenged mice per group and 6-7 OVA challenged mice per group. * p<0.05 versus PBS in mice with same genotype and treatment and # p<0.05 versus WT.

