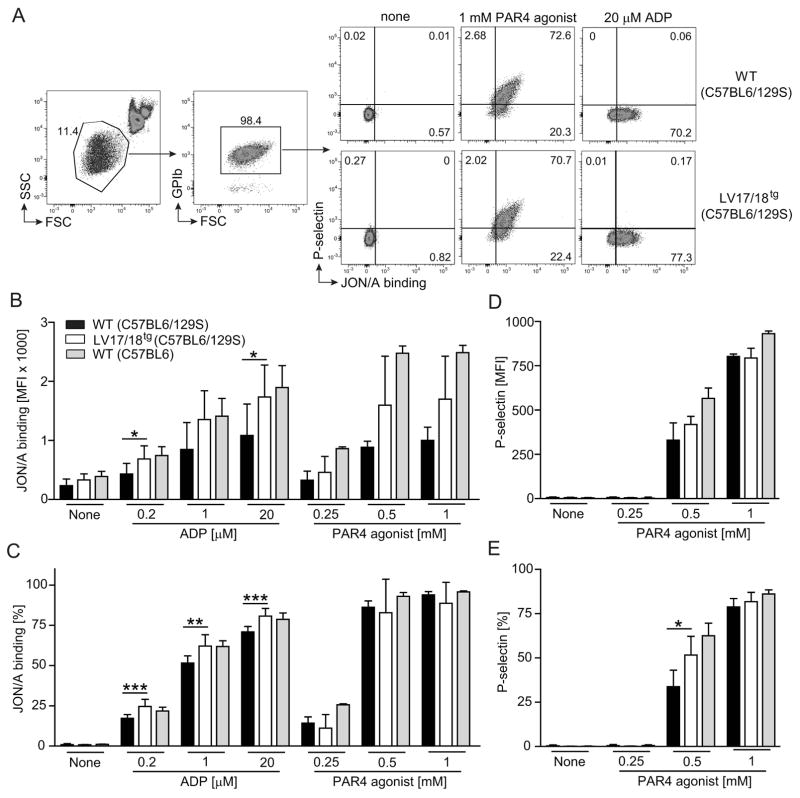
Fig. 5. Comparison of platelet activation and activatability in WT and 2bF8 expressing mice.
Activation status and activatability of platelet from WT (mixed C57BL6/129S background, n = 5 – 8), LV17/18tg (n = 4 – 7) or pure C57BL6 background WT (n = 3 – 4) mice were assessed using whole blood flow cytometry. (A) Representative dot plots show gating strategy to assess activation status of platelets. Values shown indicate the percentage of cell population. (B) MFI (mean fluorescence intensity) and (C) frequency of JON/A binding platelets are shown. (D) MFI and (E) frequency of surface P-selectin expressing platelets are shown. Indicated concentrations of ADP or PAR4 agonist were used in vitro to activate platelets. Although LV17/18tg platelets appeared hyper-activated compared with platelets from mixed 129S/C57BL6 background WT mice, platelet activation in LV17/18tg mice under all stimulation conditions was similar or lower than in WT mice on a pure C57BL6 background. Significance levels between WT and L17/18tg samples are indicated. *P < 0.05, **P < 0.01, ***P < 0.001(Student’s t-test).

