Figure 4.
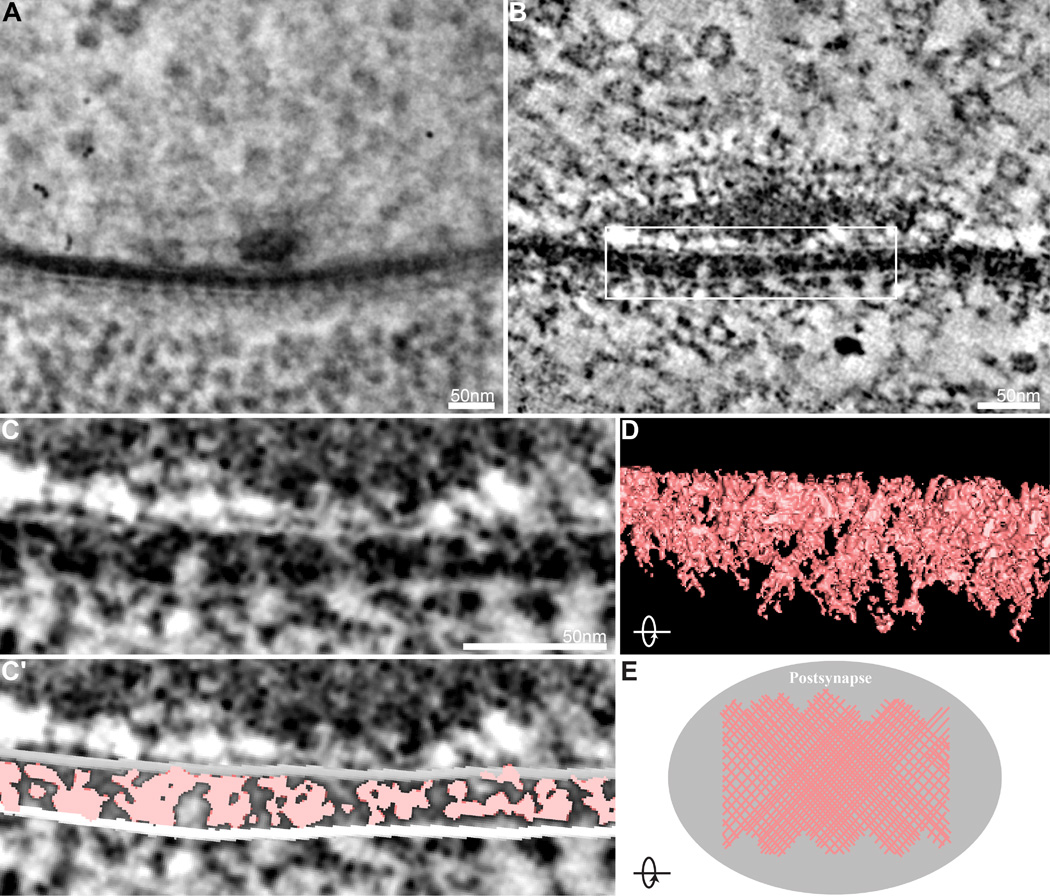
Net-like organization of synaptic cleft densities. (A) Representative electron micrograph of a Drosophila motor synapse from a central position during a 120° tilt series of a 250-nm section shows periodic organization of the synaptic cleft. (B) A representative virtual slice of the tomogram generated from the tilt series in A, where fine details of the transsynaptic ultrastructure are readily identified. (C,C′) Higher magnification of the boxed region of the tomogram virtual slice in B (C) and the same virtual slice with segmentation of synaptic cleft ultrastructure superimposed (C′). (D) Rotating the 3D model of the segmented synaptic cleft 90° reveals a net-like scaffold of interwoven molecules. (E) Top-view model of the organization of ultrastructural elements in the synaptic cleft, where the density of the net-like scaffold increases at the synapse core.

