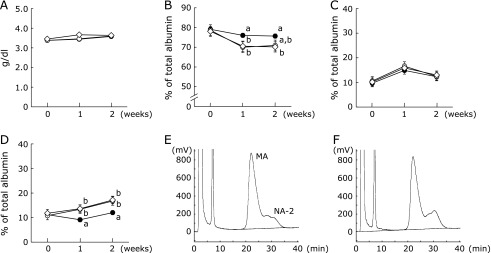
Fig. 2.
Body weight, plasma albumin concentration and oxidized/reduced ratio of plasma albumin in rats with restricted food intake. Rats were fed a 20% casein diet. Rats in the control group (n = 6, closed circles) were fed ad libitum. The other rats were fed 75% (75R group, n = 6, open circles) or 50% (50R group, n = 6, open squares) of the amount of food consumed by rats in the control group on the previous day. Blood was drawn from the tail vein every week. Plasma albumin concentrations were monitored (A). The percentages of MA (B), NA-1 (C) and NA-2 (D) within total albumin were analyzed by HPLC. The HPLC conditions were the same as those in Fig. 1. Values represent the mean ± SEM. Means not sharing the same letter are significantly different from each other (p<0.05). Typical HPLC profiles of plasma albumin from rats in the control (E) and 75R (F) groups at 2 weeks after the start of the experiment are shown.

