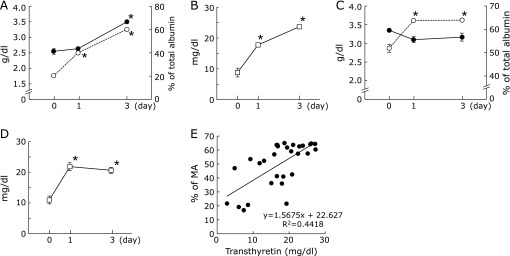
Fig. 3.
Plasma albumin concentration, percentage of reduced albumin and plasma transthyretin concentration in refed rats. Rats (n = 6) were fed a 3% casein diet for 3 weeks and then refed with a 20% casein diet ad libitum (A, B). Other rats (n = 6) were fed for 3 weeks a 20% casein diet restricted to 50% of the amount of food consumed by the control rats as described in Fig. 2 and then refed with a 20% casein diet ad libitum (C, D). Blood was drawn from the tail vein. Plasma albumin concentrations were monitored (A, C, closed circles) and the percentages of MA within total albumin were analyzed by HPLC (A, C, open circles). The HPLC conditions were the same as those in Fig. 1. Plasma transthyretin concentrations were also monitored (B, D). Values represent the mean ± SEM. *p<0.05 as compared with before refeeding (0 day). The relationship between the percentages of MA and transthyretin concentrations is shown (E).

