
FIGURE 2.
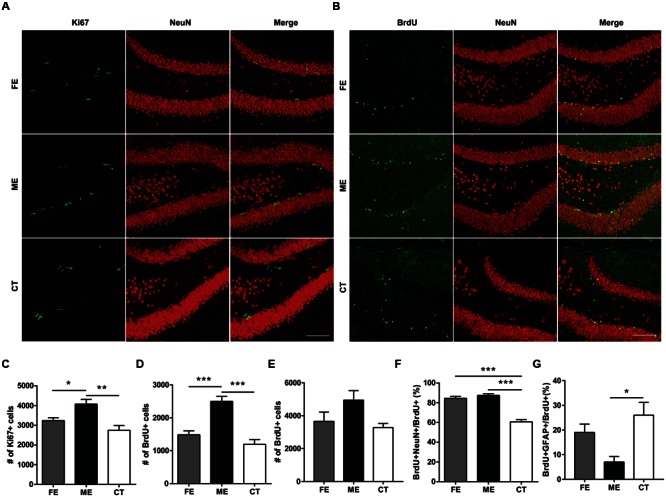
Cellular proliferation, differentiation, and survival in the dentate gyrus (DG) of mice subjected to distinct training paradigms. (A) Representative images of Ki67+ cells and their colocalization with NeuN in FE, ME, and CT mice, respectively. Scale bar = 100 μm. (B) Representative images of BrdU+ cells and their colocalization with NeuN in FE, ME, and CT mice, respectively. Scale bar = 100 μm. (C) Quantification of Ki67+ cells reveals a significant decrease in their total number in FE mice when compared to ME mice. One-way ANOVA, F2,12 = 9.429, P = 0.0035; post hoc test: ME vs. FE: ∗P < 0.05; ME vs. CT: ∗∗P < 0.01; FE vs. CT: P > 0.05; n = 5 in each group. (D) Quantification of BrdU+ cells reveals a significant decrease in their total number in FE mice as compared to ME mice. One-way ANOVA, F2,12 = 24.06, P < 0.0001; post hoc test: ME vs. FE: ∗∗∗P < 0.001; ME vs. CT: ∗∗∗P < 0.001; FE vs. CT: P > 0.05; n = 5 in each group. (E) Cellular proliferation in the DG of mice subjected to 2-week training. Quantification of BrdU+ cells reveals no significant change in their total number in FE or ME mice. One-way ANOVA, F2,12 = 3.254, P = 0.0743; n = 5 in each group. (F) Quantification of the ratios of BrdU+NeuN+ cells to BrdU+ cells in the FE, ME, and CT groups. One-way ANOVA, F2,12 = 54.26, P < 0.0001; post hoc test: ME vs. CT: ∗∗∗P < 0.001; FE vs. CT: ∗∗∗P < 0.001; FE vs. ME: P > 0.05; n = 5 in each group. (G) Astrocyte differentiation in the DG of mice subjected to 6-week training. Quantification of the ratios of BrdU+GFAP+ cells to BrdU+ cells in the FE, ME, and CT groups. One-way ANOVA, F2,12 = 6.379, P = 0.013; post hoc test: ME vs. CT: ∗P < 0.05; ME vs. FE: P > 0.05; FE vs. CT: P > 0.05; n = 5 in each group.