
FIGURE 3.
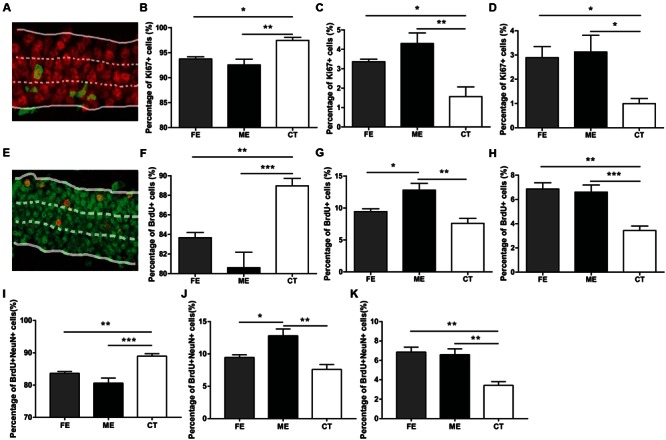
Distribution of new neurons in the granule cell layer (GCL) of runners. (A) A sample photomicrograph of Ki67+ cells in the GCL. (B) Both FE and ME groups have a lower percentage of Ki67+ cells located in the innermost GCL than the CT group. One-way ANOVA, F2,12 = 5.594, P = 0.0192; post hoc test: ME vs. CT: ∗∗P < 0.01; ME vs. FE: ∗P > 0.05; FE vs. CT: P > 0.05; n = 5 in each group. (C) Both FE and ME groups have a higher percentage of Ki67+ cells located in the middle GCL than the CT group. One-way ANOVA, F2,12 = 10.27, P = 0.0025; post hoc test: ME vs. CT: ∗∗P < 0.01; ME vs. FE: P > 0.05; FE vs. CT: ∗P < 0.05; n = 5 in each group. (D) Both FE and ME groups have a higher percentage of Ki67+ cells located in the outermost GCL than the CT group. One-way ANOVA, F2,12 = 10.80, P = 0.0021; post hoc test: ME vs. CT: ∗P < 0.05; ME vs. FE: P > 0.05; FE vs. CT: ∗P < 0.05; n = 5 in each group. (E) A sample photomicrograph of BrdU+ cells in the GCL. (F) Both FE and ME groups have a lower percentage of BrdU+ cells located in the innermost GCL than the CT group. One-way ANOVA, F2,12 = 14.29, P = 0.0007; post hoc test: ME vs. CT: ∗∗∗P < 0.001; ME vs. FE: P > 0.05; FE vs. CT: ∗∗P < 0.01; n = 5 in each group. (G) The ME group has a higher percentage of BrdU+ cells located in the middle GCL than the FE and CT groups. One-way ANOVA, F2,12 = 10.96, P = 0.0020; post hoc test: ME vs. CT: ∗∗P < 0.01; ME vs. FE: ∗P < 0.05; FE vs. CT: P > 0.05; n = 5 in each group. (H) Both FE and ME groups have a higher percentage of BrdU+ cells located in the outermost GCL than the CT group. One-way ANOVA, F2,12 = 16.25, P = 0.0004; post hoc test: ME vs. CT: ∗∗∗P < 0.001; ME vs. FE: P > 0.05; FE vs. CT: ∗∗P < 0.01; n = 5 in each group. (I) Both FE and ME groups have a lower percentage of BrdU+NeuN+ cells located in the innermost GCL than the CT group. One-way ANOVA, F2,12 = 16.25, P = 0.0004; post hoc test: ME vs. CT: ∗∗∗P < 0.001; ME vs. FE: P > 0.05; FE vs. CT: ∗∗P < 0.01; n = 5 in each group. (J) ME group has a higher percentage of BrdU+NeuN+ cells located in the middle GCL than the CT group. One-way ANOVA, F2,12 = 10.96, P = 0.0020; post hoc test: ME vs. CT: ∗∗P < 0.01; ME vs. FE: ∗P < 0.05; FE vs. CT: P > 0.05; n = 5 in each group. (K) Both FE and ME groups have a higher percentage of BrdU+NeuN+ cells located in the outermost GCL than the CT group. One-way ANOVA, F2,12 = 14.29, P = 0.0007; post hoc test: ME vs. CT: ∗∗P < 0.01; ME vs. FE: P > 0.05; FE vs. CT: ∗∗P < 0.01; n = 5 in each group.