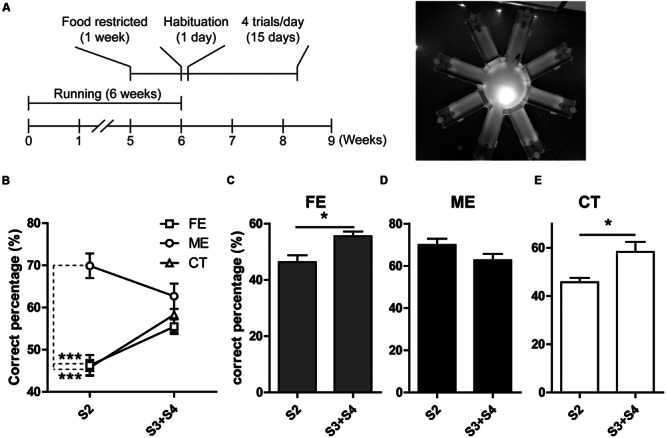
FIGURE 4.

Analysis of behavior in the RAM. (A) Left, timeline of the RAM test. Right, photograph of the RAM arena. (B) ME but not FE increases the percent of correct choices at S2. Neither of them has effect on the percent of correct choices at S3 + S4 separations. Two-way ANOVA, F2,18 = 19.57, P < 0.0001; post hoc test: ME vs. CT: ∗∗∗P < 0.001; ME vs. FE: ∗∗∗P < 0.001; FE vs. CT: P > 0.05; n = 7 in each group. (C) The FE group shows a higher percent of correct choices at S3 + S4 than at S2. Paired t-test, ∗P < 0.05. (D) The ME group shows a percent of correct choices at S2 similar to that at S3 + S4. Paired t-test, P > 0.05. (E) The CT group has a higher percent of correct choices at S3 + S4 than at S2. Paired t-test, ∗P < 0.05.
