
Figure 2.
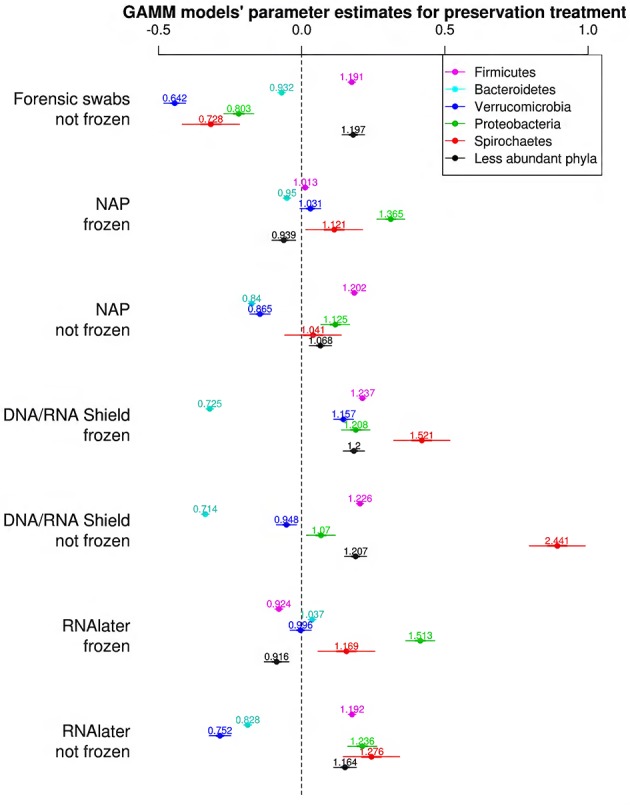
Parameter estimates (points), 95% confidence intervals (thin lines), and standard deviation (thick lines) from GAMMs modeling the effect of preservation treatment on the proportion of OTUs belonging to the bacterial phyla Firmicutes, Bacteroidetes, Verrucomicrobia, Proteobacteria, Spirochaetes, and the remaining less abundant phyla. The intercept was the control treatment (forensic swaps immediately frozen) of the samples. The dashed line represents the intercept, and a parameter estimate from a preservation treatment with 95% confidence intervals that do not overlap this dashed line represents a significant deviation from the control treatment. The response variable and the explanatory variable “number of sequences“ were scaled allowing a relative comparison of the effect of preservation buffers between measures of alpha diversity (but this means that absolute values of the intercept and number of sequences are not represented here). Numbers above parameter estimates are odds ratios that represent the deviation in the proportion of OTUs belonging to a phylum within a preservation treatment relative to the control treatment (Forensic swabs/frozen).