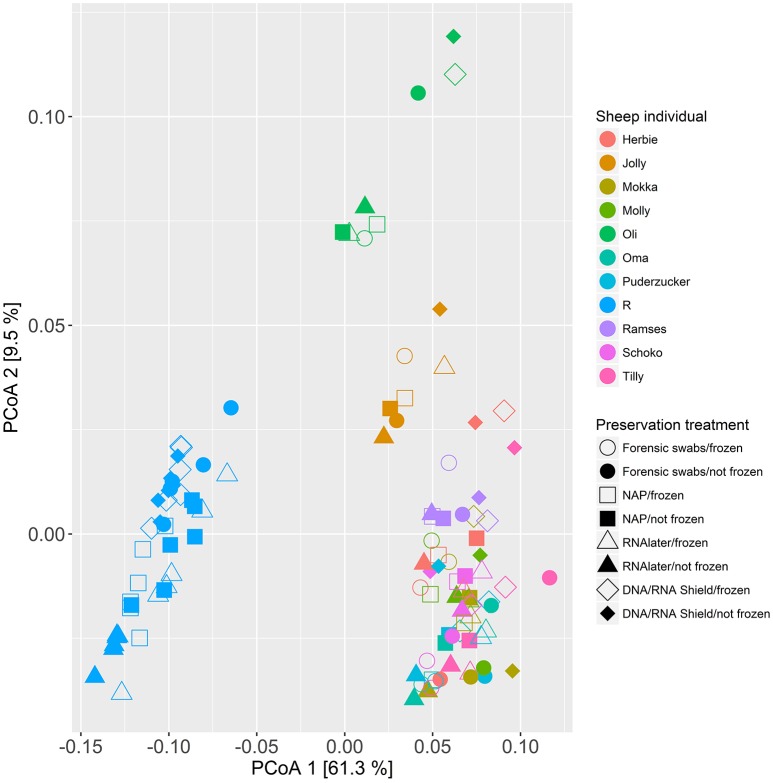
Figure 5.
Principal coordinate analysis (PCoA) of samples of all sheep individuals according to preservation treatment based on the weighted-UniFrac metric. The x-axis and y-axis together explain 70.8% of the total variation. Most of the variation was explained by sheep individual (ΔAICc = 189.10; R2 = 0.77), followed by preservation treatment (ΔAICc = 43.89; R2 = 0.10).

