
Figure 1.
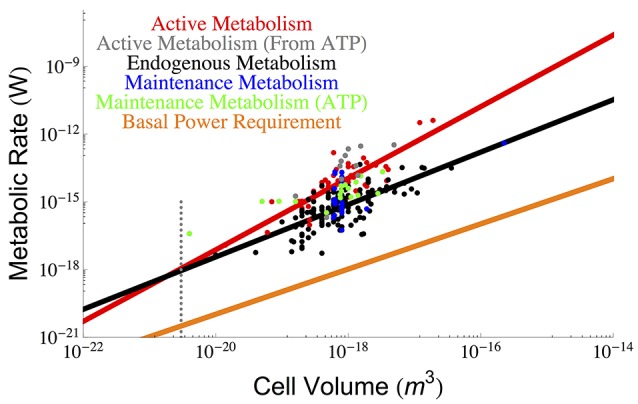
The overall scaling of total (red) and endogenous (black) metabolism with cell size along with the OLS power law fits. The data are from the (DeLong, 2010) who reanalyzed two papers by (Makarieva et al., 2008, 2005). Our reanalysis using OLS fits results in a prediction for a lower bound on bacterial size that is consistent with the previous predictions of the cell size at which maintenance is expected to dominate cellular metabolism and reduce the growth rate to zero (Kempes et al., 2012). It can be seen that this occurs at roughly the size of the smallest observed bacteria, and this result adds another limitation to the small end of life along with previously uncovered constraints on growth rate and total space (Knoll et al., 1999; Kempes et al., 2012, 2016). Data for true maintenance rates as defined by Pirt (1965), and estimated from ATP (Lynch and Marinov, 2015) (green points) or glucose and oxygen requirements (Kempes et al., 2012) (blue points) agree on average with the endogenous metabolic rates, although the ATP values are slightly higher. The active metabolic rates estimated from ATP requirements (Lynch and Marinov, 2015), (gray points) are slightly higher than the active metabolic rates reported by DeLong (2010) and Makarieva et al. (2005), which is to be expected because the latter two studies are not exclusively based on values corresponding to maximal growth rates. The dotted gray line indicates the smallest known bacterial cells (Luef et al., 2015; Kempes et al., 2016).