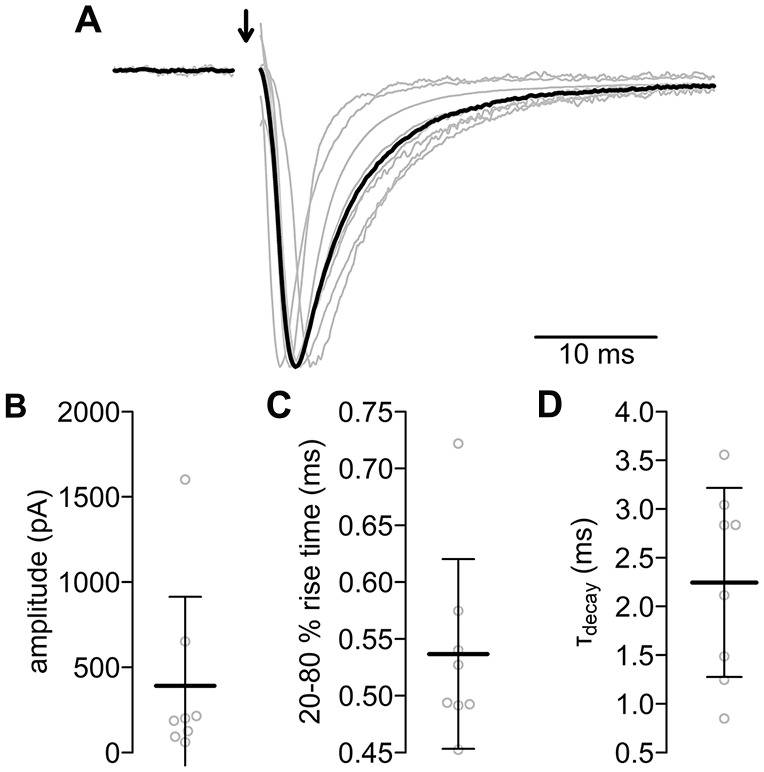
Figure 4.

Evoked postsynaptic currents of the PIR-MD synapses. (A) All normalized excitatory postsynaptic currents (EPSCs; gray lines) and their average (black). The stimulus artifact was removed (arrow). Scatterplots of (B) amplitude, (C) rise time and (D) decay time constant. Lines are mean ± standard deviation (SD).
